\n
## Line Chart: Similarity of Reasoning Steps
### Overview
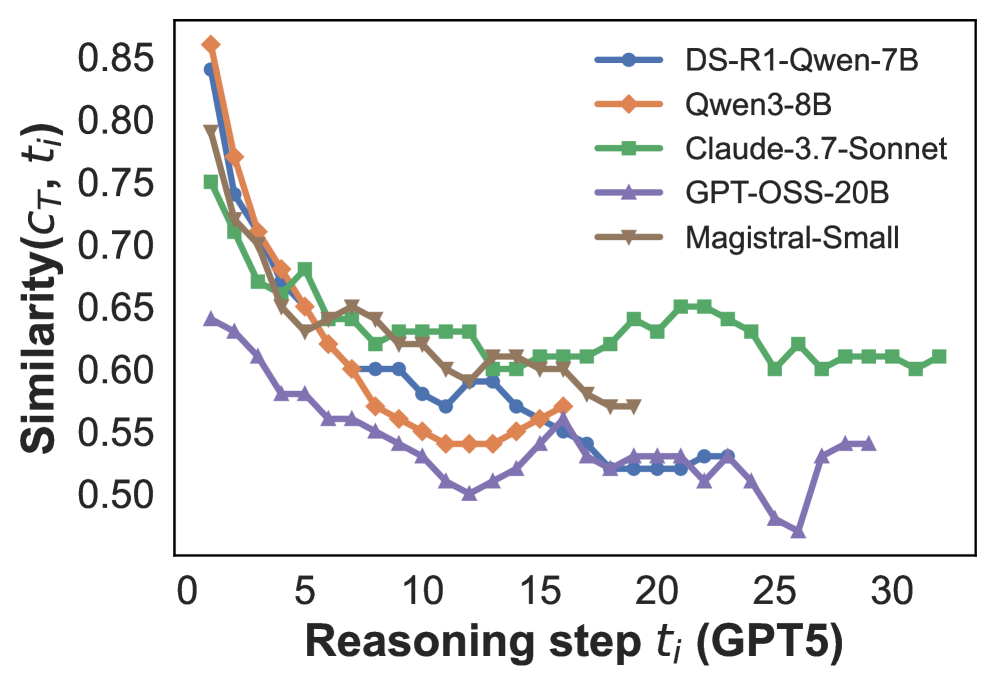
The image presents a line chart illustrating the similarity (Similarity(Cτ, t)) between reasoning steps (Reasoning step tᵢ (GPT5)) for five different language models: DS-R1-Qwen-7B, Qwen3-8B, Claude-3.7-Sonnet, GPT-OSS-20B, and Magistral-Small. The chart displays how similarity changes as the reasoning step number increases from 0 to approximately 32.
### Components/Axes
* **X-axis:** Reasoning step tᵢ (GPT5), ranging from 0 to 32.
* **Y-axis:** Similarity(Cτ, t), ranging from 0.50 to 0.85.
* **Legend:** Located in the top-right corner, identifying each line with a corresponding color:
* DS-R1-Qwen-7B (Blue)
* Qwen3-8B (Orange)
* Claude-3.7-Sonnet (Green)
* GPT-OSS-20B (Purple)
* Magistral-Small (Brown)
### Detailed Analysis
Here's a breakdown of each line's trend and approximate data points:
* **DS-R1-Qwen-7B (Blue):** The line starts at approximately 0.83 at step 0, then decreases steadily to around 0.53 at step 10. It fluctuates between approximately 0.53 and 0.56 from step 10 to 25, with a dip to around 0.51 at step 27, and ends at approximately 0.54 at step 32.
* **Qwen3-8B (Orange):** This line begins at approximately 0.81 at step 0, decreasing to around 0.58 at step 10. It then rises slightly to around 0.61 at step 15, before decreasing again to approximately 0.56 at step 20. It fluctuates between 0.56 and 0.59 from step 20 to 32, ending at approximately 0.58.
* **Claude-3.7-Sonnet (Green):** The line starts at approximately 0.66 at step 0, decreasing to around 0.61 at step 5. It then increases to a peak of approximately 0.67 at step 12, before fluctuating between approximately 0.61 and 0.64 from step 15 to 32, ending at approximately 0.62.
* **GPT-OSS-20B (Purple):** This line begins at approximately 0.65 at step 0, decreasing to around 0.54 at step 10. It remains relatively stable between approximately 0.53 and 0.56 from step 10 to 32, ending at approximately 0.54.
* **Magistral-Small (Brown):** The line starts at approximately 0.65 at step 0, decreasing to around 0.57 at step 5. It then decreases further to approximately 0.54 at step 10, and fluctuates between approximately 0.54 and 0.58 from step 10 to 32, ending at approximately 0.56.
### Key Observations
* All models exhibit a decreasing trend in similarity during the initial reasoning steps (0-10).
* Claude-3.7-Sonnet maintains the highest similarity scores throughout the reasoning process, although it also experiences a decrease initially.
* DS-R1-Qwen-7B and GPT-OSS-20B show the lowest similarity scores, particularly after step 10.
* Qwen3-8B and Magistral-Small exhibit similar behavior, with fluctuating similarity scores after the initial decrease.
* The similarity scores tend to stabilize after approximately 15 reasoning steps for most models.
### Interpretation
The chart suggests that the reasoning processes of these language models diverge as the number of reasoning steps increases. The initial decrease in similarity indicates that the models are exploring different paths or focusing on different aspects of the problem. The stabilization of similarity scores after a certain number of steps suggests that the models are converging towards a more consistent understanding or solution.
The higher similarity scores of Claude-3.7-Sonnet may indicate a more robust or coherent reasoning process compared to the other models. The lower similarity scores of DS-R1-Qwen-7B and GPT-OSS-20B could suggest that these models are more prone to exploring diverse or potentially less relevant reasoning paths.
The fluctuations in similarity scores for Qwen3-8B and Magistral-Small might reflect the models' ability to adapt and refine their reasoning based on the information gathered during each step. The chart provides valuable insights into the reasoning dynamics of different language models and can be used to assess their strengths and weaknesses in complex problem-solving tasks.