## Line Chart: Model Similarity Over Reasoning Steps
### Overview
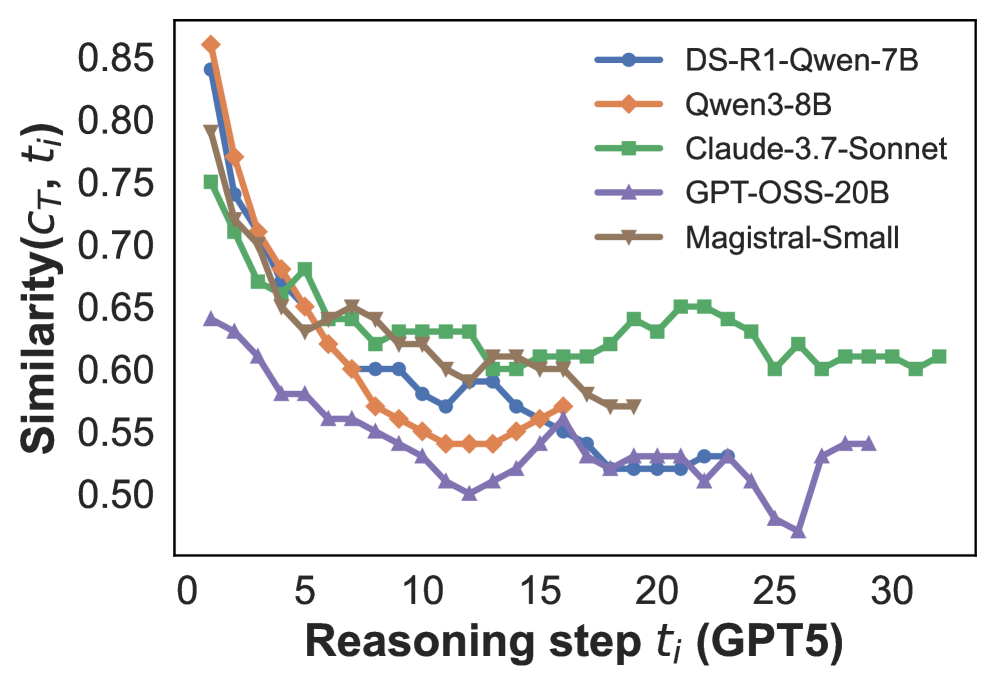
The image depicts a line chart comparing the similarity metric (C_T, t_i) of five AI models across reasoning steps (t_i) from 0 to 30. The y-axis represents similarity scores (0.50–0.85), while the x-axis represents discrete reasoning steps labeled as "GPT5". Five distinct data series are plotted, each corresponding to a different model.
### Components/Axes
- **X-axis**: "Reasoning step t_i (GPT5)" with integer ticks from 0 to 30.
- **Y-axis**: "Similarity (C_T, t_i)" with decimal ticks from 0.50 to 0.85.
- **Legend**: Located in the top-right corner, mapping colors to models:
- Blue circles: DS-R1-Qwen-7B
- Orange diamonds: Qwen3-8B
- Green squares: Claude-3.7-Sonnet
- Purple triangles: GPT-OSS-20B
- Brown inverted triangles: Magistral-Small
### Detailed Analysis
1. **DS-R1-Qwen-7B (Blue)**:
- Starts at ~0.85 similarity at t_i=0.
- Declines sharply to ~0.60 by t_i=10.
- Stabilizes between 0.55–0.60 from t_i=15–30.
2. **Qwen3-8B (Orange)**:
- Begins at ~0.80 similarity at t_i=0.
- Drops to ~0.55 by t_i=10.
- Shows minor fluctuations but remains below 0.60 after t_i=15.
3. **Claude-3.7-Sonnet (Green)**:
- Initial similarity ~0.75 at t_i=0.
- Gradual decline to ~0.60 by t_i=15.
- Plateaus between 0.60–0.65 from t_i=20–30.
4. **GPT-OSS-20B (Purple)**:
- Starts at ~0.65 similarity at t_i=0.
- Sharp drop to ~0.50 by t_i=10.
- Recovers slightly to ~0.55 by t_i=20, then fluctuates between 0.50–0.55.
5. **Magistral-Small (Brown)**:
- Begins at ~0.78 similarity at t_i=0.
- Steady decline to ~0.58 by t_i=20.
- Minor recovery to ~0.60 at t_i=25, then stabilizes.
### Key Observations
- All models exhibit a general decline in similarity as reasoning steps increase.
- **DS-R1-Qwen-7B** and **Magistral-Small** maintain the highest initial similarity but decline sharply.
- **Claude-3.7-Sonnet** shows the most stable performance, retaining ~0.60 similarity at t_i=30.
- **GPT-OSS-20B** has the most erratic trend, with a pronounced dip at t_i=25.
- No model sustains similarity above 0.65 beyond t_i=5.
### Interpretation
The data suggests that AI model performance (as measured by similarity) degrades with increasing reasoning complexity (t_i). Models with higher initial similarity (e.g., DS-R1-Qwen-7B) experience steeper declines, potentially indicating overfitting or limited generalization. **Claude-3.7-Sonnet**'s gradual decline implies better robustness to extended reasoning steps. The fluctuations in GPT-OSS-20B and Magistral-Small may reflect sensitivity to specific reasoning patterns or computational constraints. The absence of any model maintaining high similarity beyond t_i=10 highlights a critical challenge in scaling AI reasoning capabilities.