\n
## Line Charts: Training Dynamics with Varying Cosine Cycle Lengths
### Overview
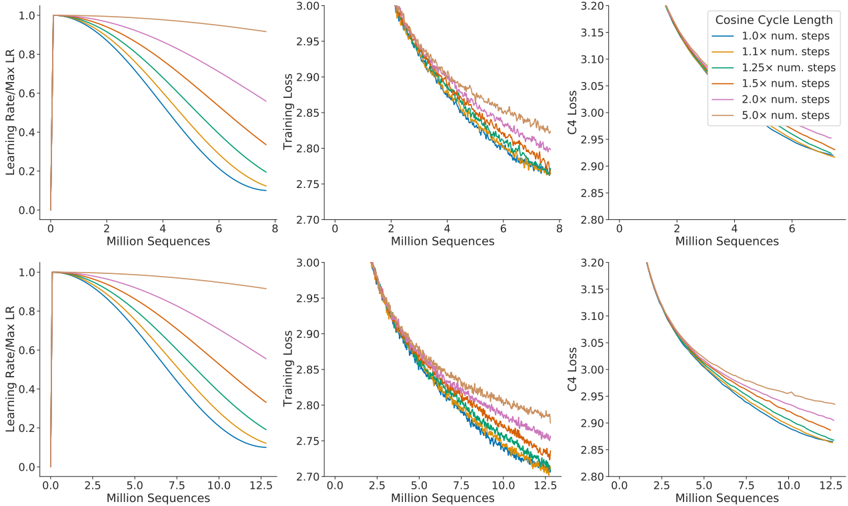
The image presents six line charts arranged in a 2x3 grid, visualizing the training dynamics of a model under different cosine cycle lengths. Each chart displays a different metric (Learning Rate/Max LR, Training Loss, and C4 Loss) against the number of Million Sequences. The charts aim to compare the impact of varying cosine cycle lengths on the training process.
### Components/Axes
Each chart shares the following components:
* **X-axis:** "Million Sequences" ranging from 0 to approximately 8 in the top row and 0 to 12.5 in the bottom row.
* **Y-axis:** Varies depending on the chart:
* Top-left: "Learning Rate/Max LR" ranging from 0 to 1.0.
* Top-center & Bottom-center: "Training Loss" ranging from 2.70 to 3.00.
* Top-right & Bottom-right: "C4 Loss" ranging from 2.80 to 3.20.
* **Legend:** Located in the top-right corner of each chart, listing the "Cosine Cycle Length" values:
* 1.0x num. steps (Blue)
* 1.1x num. steps (Green)
* 1.25x num. steps (Purple)
* 1.5x num. steps (Orange)
* 2.0x num. steps (Pink)
* 5.0x num. steps (Red)
### Detailed Analysis or Content Details
**Top Row:**
* **Learning Rate/Max LR (Top-Left):** All lines start at 1.0 and decrease towards 0. The blue (1.0x) line shows the steepest decline, followed by green (1.1x), purple (1.25x), orange (1.5x), pink (2.0x), and red (5.0x) exhibiting progressively slower declines.
* At 8 Million Sequences:
* Blue (1.0x): ~0.05
* Green (1.1x): ~0.15
* Purple (1.25x): ~0.25
* Orange (1.5x): ~0.35
* Pink (2.0x): ~0.50
* Red (5.0x): ~0.75
* **Training Loss (Top-Center):** All lines start around 2.95 and decrease. The blue (1.0x) line shows the fastest decrease, followed by green (1.1x), purple (1.25x), orange (1.5x), pink (2.0x), and red (5.0x). There are noticeable fluctuations in all lines, particularly between 4 and 6 Million Sequences.
* At 8 Million Sequences:
* Blue (1.0x): ~2.72
* Green (1.1x): ~2.75
* Purple (1.25x): ~2.78
* Orange (1.5x): ~2.82
* Pink (2.0x): ~2.86
* Red (5.0x): ~2.90
* **C4 Loss (Top-Right):** All lines start around 3.15 and decrease. The blue (1.0x) line shows the fastest decrease, followed by green (1.1x), purple (1.25x), orange (1.5x), pink (2.0x), and red (5.0x). Similar fluctuations are observed as in the Training Loss chart.
* At 8 Million Sequences:
* Blue (1.0x): ~2.85
* Green (1.1x): ~2.88
* Purple (1.25x): ~2.92
* Orange (1.5x): ~2.95
* Pink (2.0x): ~2.98
* Red (5.0x): ~3.05
**Bottom Row:**
* **Learning Rate/Max LR (Bottom-Left):** Similar trend to the top-left chart, but extending to 12.5 Million Sequences.
* At 12.5 Million Sequences:
* Blue (1.0x): ~0.02
* Green (1.1x): ~0.08
* Purple (1.25x): ~0.15
* Orange (1.5x): ~0.25
* Pink (2.0x): ~0.40
* Red (5.0x): ~0.65
* **Training Loss (Bottom-Center):** Similar trend to the top-center chart, extending to 12.5 Million Sequences.
* At 12.5 Million Sequences:
* Blue (1.0x): ~2.70
* Green (1.1x): ~2.72
* Purple (1.25x): ~2.75
* Orange (1.5x): ~2.78
* Pink (2.0x): ~2.83
* Red (5.0x): ~2.88
* **C4 Loss (Bottom-Right):** Similar trend to the top-right chart, extending to 12.5 Million Sequences.
* At 12.5 Million Sequences:
* Blue (1.0x): ~2.80
* Green (1.1x): ~2.83
* Purple (1.25x): ~2.87
* Orange (1.5x): ~2.91
* Pink (2.0x): ~2.95
* Red (5.0x): ~3.02
### Key Observations
* Shorter cosine cycle lengths (1.0x and 1.1x) consistently lead to faster decreases in Learning Rate and Loss metrics.
* Longer cosine cycle lengths (2.0x and 5.0x) result in slower decreases and higher final loss values.
* All charts exhibit fluctuations in the loss curves, suggesting instability or oscillations during training.
* The bottom row charts, extending to 12.5 Million Sequences, show that the differences in performance between different cycle lengths become more pronounced over longer training periods.
### Interpretation
The data suggests that the choice of cosine cycle length significantly impacts the training dynamics of the model. Shorter cycle lengths promote faster initial learning and lower final loss values, but may also lead to instability as indicated by the fluctuations in the loss curves. Longer cycle lengths provide more stable training but at the cost of slower learning and potentially higher final loss.
The relationship between the metrics is clear: as the Learning Rate decreases (due to the cosine schedule), the Training Loss and C4 Loss also decrease. The rate at which these metrics change is influenced by the cosine cycle length.
The fluctuations in the loss curves could be due to various factors, such as the learning rate being too high, the batch size being too small, or the model architecture being complex. Further investigation would be needed to determine the root cause of these oscillations. The extended training in the bottom row charts highlights the importance of considering long-term training behavior when selecting a cosine cycle length. A shorter cycle length might initially appear superior, but its instability could prevent it from reaching optimal performance over extended training.