\n
## Line Charts: Impact of Cosine Cycle Length on Learning Rate Schedule and Loss Metrics
### Overview
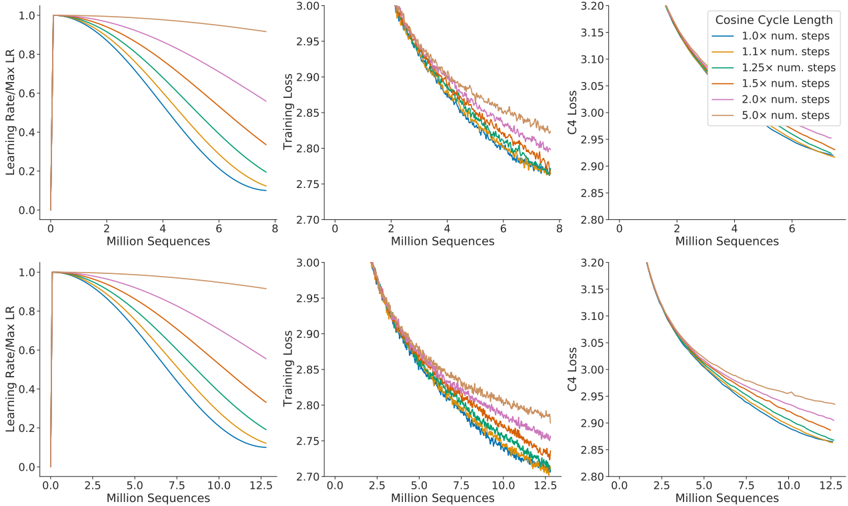
The image displays a set of six line charts arranged in a 2x3 grid. The charts analyze the effect of varying the "Cosine Cycle Length" (defined as a multiplier of the number of training steps) on three key training metrics: the learning rate schedule, training loss, and C4 validation loss. The top row shows results for a training run of approximately 8 million sequences, while the bottom row shows results for a longer run of approximately 12.5 million sequences.
### Components/Axes
* **Grid Structure:** 2 rows x 3 columns.
* **Top Row X-Axis:** "Million Sequences" (range: 0 to 8).
* **Bottom Row X-Axis:** "Million Sequences" (range: 0 to 12.5).
* **Column 1 Y-Axis:** "Learning Rate/Max LR" (range: 0.0 to 1.0). This shows the normalized learning rate schedule.
* **Column 2 Y-Axis:** "Training Loss" (range: 2.70 to 3.00).
* **Column 3 Y-Axis:** "C4 Loss" (range: 2.80 to 3.20).
* **Legend:** Located in the top-right chart (Top Row, Column 3). It is titled "Cosine Cycle Length" and defines six colored lines:
* Blue: `1.0x num. steps`
* Orange: `1.1x num. steps`
* Green: `1.25x num. steps`
* Red: `1.5x num. steps`
* Purple: `2.0x num. steps`
* Brown: `5.0x num. steps`
* **Spatial Grounding:** The legend is consistently placed in the top-right corner of the third chart in each row. The line colors and their corresponding labels are consistent across all six charts.
### Detailed Analysis
**1. Learning Rate Schedule (Column 1):**
* **Trend:** All lines start at a normalized learning rate of 1.0. They follow a cosine decay schedule, but the rate of decay is determined by the cycle length multiplier.
* **Data Points & Relationships:**
* The **Blue line (1.0x)** decays the fastest, reaching near 0.1 by 8M sequences (top row) and by 12.5M sequences (bottom row).
* The **Brown line (5.0x)** decays the slowest, remaining above 0.9 by 8M sequences and above 0.8 by 12.5M sequences.
* The decay rate orders from fastest to slowest is: Blue (1.0x) > Orange (1.1x) > Green (1.25x) > Red (1.5x) > Purple (2.0x) > Brown (5.0x). This order is visually clear and consistent in both rows.
**2. Training Loss (Column 2):**
* **Trend:** All lines show a decreasing trend, indicating the model is learning. The lines are noisy but follow distinct paths.
* **Data Points & Relationships:**
* At the end of training (8M or 12.5M sequences), the final loss values are ordered inversely to the learning rate decay speed.
* **Fastest Decay (Blue, 1.0x):** Achieves the **lowest** final training loss (approx. 2.76 at 8M, approx. 2.72 at 12.5M).
* **Slowest Decay (Brown, 5.0x):** Results in the **highest** final training loss (approx. 2.83 at 8M, approx. 2.78 at 12.5M).
* The intermediate lines (Orange, Green, Red, Purple) fall between these extremes, maintaining the same order as the learning rate chart.
**3. C4 Loss (Column 3):**
* **Trend:** Similar to training loss, all lines show a decreasing trend on this validation metric.
* **Data Points & Relationships:**
* The pattern mirrors the training loss. Faster learning rate decay leads to lower final C4 loss.
* **Blue (1.0x):** Lowest final C4 loss (approx. 2.92 at 8M, approx. 2.85 at 12.5M).
* **Brown (5.0x):** Highest final C4 loss (approx. 2.96 at 8M, approx. 2.94 at 12.5M).
* The separation between lines is slightly less pronounced than in the training loss charts, but the ordering is identical.
### Key Observations
1. **Clear Inverse Relationship:** There is a direct and consistent inverse relationship between the cosine cycle length multiplier and model performance (lower loss). A shorter cycle (faster LR decay) leads to better final training and validation loss.
2. **Extended Training Benefit:** Comparing the top row (8M sequences) to the bottom row (12.5M sequences), all models continue to improve with more training. However, the **relative ranking** of the different cosine cycle lengths remains unchanged. The performance gap established early in training persists.
3. **Learning Rate as the Driver:** The learning rate schedule chart (Column 1) is the causal factor. The differences in the loss curves (Columns 2 & 3) are a direct consequence of how aggressively the learning rate is reduced.
### Interpretation
This data demonstrates a critical hyperparameter tuning insight for training neural networks with cosine learning rate schedules. The "Cosine Cycle Length" multiplier controls the pace of learning rate decay.
* **What the data suggests:** A more aggressive learning rate decay (cycle length close to 1.0x the number of steps) leads to better final model performance on both training and validation data in these experiments. A very slow decay (5.0x) appears to hinder the model's ability to settle into a good minimum, resulting in higher loss.
* **How elements relate:** The learning rate schedule dictates the optimization trajectory. A faster decay may help the model escape sharp minima early and converge to a broader, more generalizable minimum (as suggested by the lower C4 loss). The slower decay might keep the learning rate too high for too long, preventing fine-grained convergence.
* **Notable Anomalies/Considerations:** The ordering is perfectly consistent, which is striking. There is no crossover where a slower-decaying schedule eventually catches up. This suggests the advantage of faster decay is established early and maintained. However, it's important to note this is a single experimental setup; optimal cycle length can be task and model-dependent. The data strongly argues, for this specific scenario, against using cycle lengths significantly longer than the number of training steps.