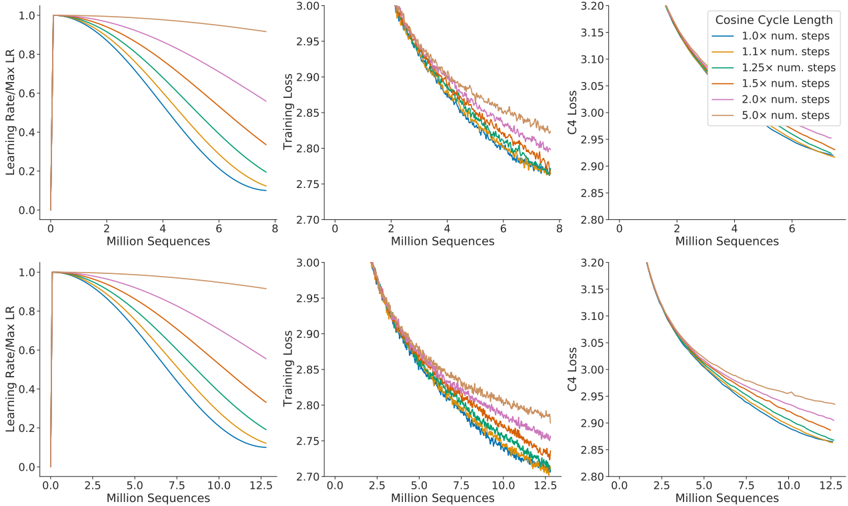
## Line Graphs: Training Dynamics Across Cosine Cycle Lengths
### Overview
The image contains six line graphs arranged in a 2x3 grid, visualizing training dynamics (learning rate, training loss, and C4 loss) across different cosine cycle lengths. Each graph shares the same x-axis ("Million Sequences") but varies in y-axis metrics and x-axis range (0–8M in top row, 0–12.5M in bottom row). All lines exhibit decreasing trends, with steeper declines for longer cosine cycle lengths.
---
### Components/Axes
1. **X-Axes**:
- Top row: "Million Sequences" (0–8M)
- Bottom row: "Million Sequences" (0–12.5M)
2. **Y-Axes**:
- Left column: "Learning Rate/Max LR" (0.0–1.0)
- Middle column: "Training Loss" (2.7–3.0)
- Right column: "C4 Loss" (2.8–3.2)
3. **Legends**:
- Positioned in the top-right corner of each graph.
- Labels: "Cosine Cycle Length" with multipliers (1.0x, 1.1x, 1.25x, 1.5x, 2.0x, 5.0x).
- Colors:
- 1.0x: Blue
- 1.1x: Orange
- 1.25x: Green
- 1.5x: Red
- 2.0x: Purple
- 5.0x: Brown
---
### Detailed Analysis
#### Left Column: Learning Rate/Max LR
- **Trends**: All lines start near 1.0 and decrease sharply, then plateau. Longer cycles (e.g., 5.0x) drop faster.
- 1.0x (blue): Gradual decline to ~0.6 at 8M sequences.
- 5.0x (brown): Steepest drop to ~0.15 at 8M sequences.
#### Middle Column: Training Loss
- **Trends**: All lines start near 3.0 and decrease, with longer cycles achieving lower loss faster.
- 1.0x (blue): Slow decline to ~2.85 at 8M sequences.
- 5.0x (brown): Rapid drop to ~2.75 at 8M sequences.
#### Right Column: C4 Loss
- **Trends**: Similar to training loss but with higher initial values (~3.2).
- 1.0x (blue): Declines to ~3.05 at 8M sequences.
- 5.0x (brown): Drops to ~2.9 at 8M sequences.
---
### Key Observations
1. **Consistent Trends**: All metrics decrease monotonically with increasing sequences.
2. **Cycle Length Impact**: Longer cosine cycles (e.g., 5.0x) achieve faster convergence but plateau earlier.
3. **Divergence at Scale**: By 12.5M sequences (bottom row), longer cycles maintain lower values than shorter ones.
4. **Color Consistency**: Legend colors match line colors across all graphs (e.g., 5.0x is always brown).
---
### Interpretation
- **Training Efficiency**: Longer cosine cycles (e.g., 5.0x) optimize learning rate schedules for faster initial progress but may over-optimize, leading to earlier plateaus.
- **Loss Correlation**: C4 Loss and training loss trends align, suggesting C4 Loss is a reliable proxy for model performance.
- **Practical Implications**: Choosing a cycle length depends on balancing speed (shorter cycles) and stability (longer cycles). The 5.0x cycle offers the fastest initial improvement but may require careful tuning to avoid premature convergence.
All data points and trends are visually consistent with the legend, confirming accurate color-label alignment.