## Kernel Density Estimation (KDE) Plot
### Overview
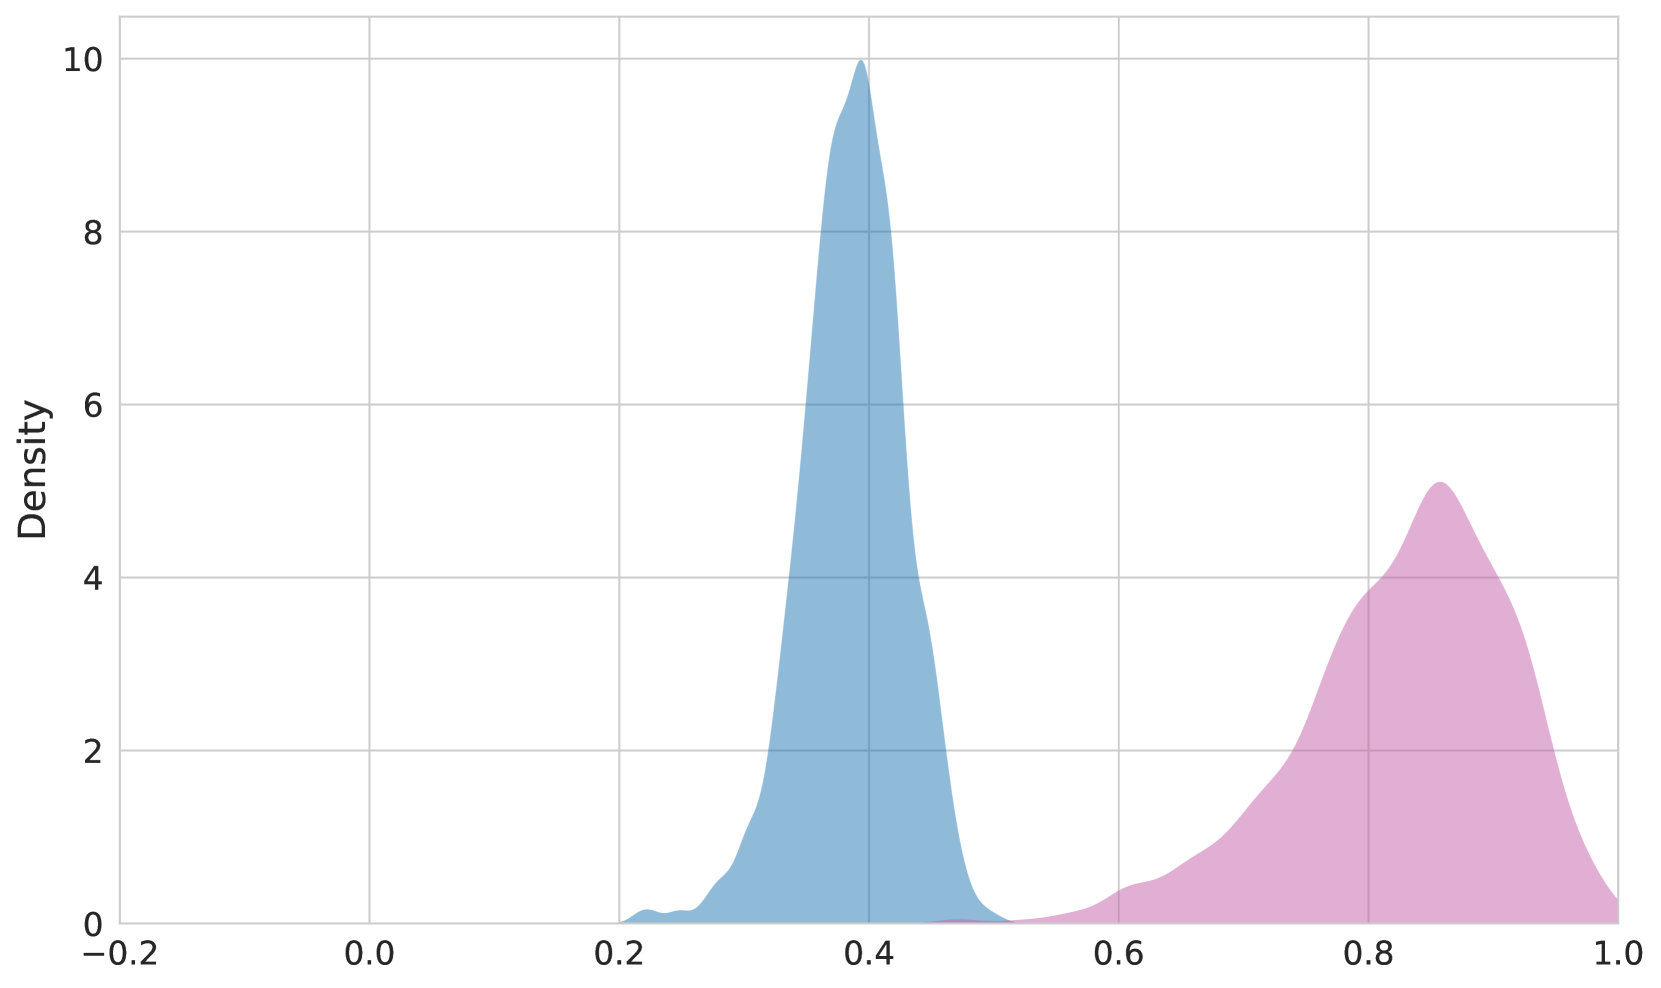
The image displays a Kernel Density Estimation (KDE) plot, which is a non-parametric way to estimate the probability density function of a random variable. The plot shows the distribution of a continuous variable, likely a measurement such as temperature, time, or another quantitative data point.
### Components/Axes
- **X-axis**: Represents the variable being measured, ranging from -0.2 to 1.0.
- **Y-axis**: Represents the density of the variable, ranging from 0 to 10.
- **Legend**: The legend is not visible in the image, but it is typically used to indicate the color coding of different data series or categories.
- **Grid**: The grid lines help in visualizing the density distribution more clearly.
### Detailed Analysis or ### Content Details
- **Blue Area**: This area represents the density of the data points. It is concentrated around the value 0.4 on the x-axis, indicating that the variable is most likely to take on values close to 0.4.
- **Pink Area**: This area represents the density of the data points. It is concentrated around the value 0.8 on the x-axis, indicating that the variable is most likely to take on values close to 0.8.
- **Peak at 0.4**: The peak at 0.4 suggests that the variable has a higher probability density at this value.
- **Peak at 0.8**: The peak at 0.8 suggests that the variable has a higher probability density at this value.
### Key Observations
- **Outliers**: There are no visible outliers in the plot, as the density is concentrated around the mean values.
- **Trends**: The plot shows two distinct peaks, indicating that the variable has two modes or clusters of values.
### Interpretation
The KDE plot suggests that the variable being measured has two modes or clusters of values. The mode at 0.4 indicates that the variable is most likely to take on values close to 0.4, while the mode at 0.8 indicates that the variable is most likely to take on values close to 0.8. This could imply that there are two distinct groups or categories within the data that are related to the variable being measured.