## Scatter Plot: Mean Log-Likelihood vs. Text Length by Source
### Overview
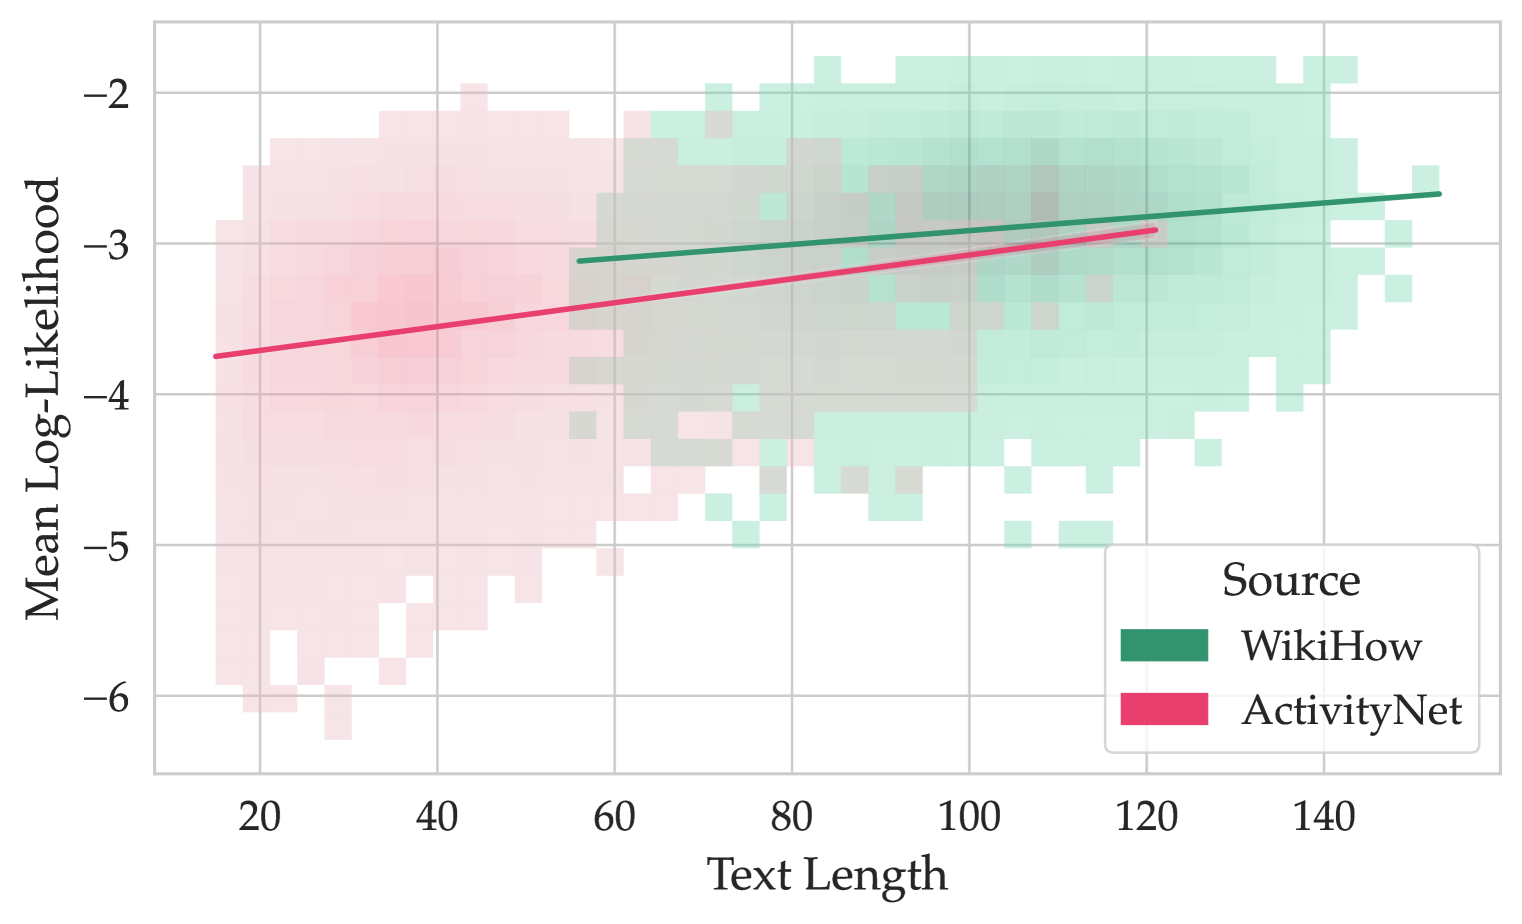
The image is a scatter plot comparing **Mean Log-Likelihood** (y-axis) against **Text Length** (x-axis) for two sources: **WikiHow** (green) and **ActivityNet** (red). Two trendlines (solid lines) represent the central tendency of each source's data points. The plot uses a grid background with square markers for data points, and the legend is positioned in the bottom-right corner.
---
### Components/Axes
- **X-Axis (Text Length)**:
- Range: 20 to 140 (increments of 20).
- Labels: "Text Length" at the bottom.
- **Y-Axis (Mean Log-Likelihood)**:
- Range: -6 to -2 (increments of 1).
- Labels: "Mean Log-Likelihood" on the left.
- **Legend**:
- Located in the bottom-right corner.
- **Green**: WikiHow.
- **Red**: ActivityNet.
---
### Detailed Analysis
#### WikiHow (Green)
- **Data Points**:
- Clustered primarily between **Text Length 60–140** and **Mean Log-Likelihood -3 to -2**.
- Density decreases for shorter texts (<60) and longer texts (>120).
- **Trendline**:
- Slopes upward from ~(-3, 60) to ~(-2, 140).
- Indicates a positive correlation between text length and mean log-likelihood.
#### ActivityNet (Red)
- **Data Points**:
- Clustered between **Text Length 20–80** and **Mean Log-Likelihood -4 to -3**.
- Fewer points at extremes (e.g., <20 or >80 text length).
- **Trendline**:
- Slopes upward from ~(-4, 20) to ~(-3, 80).
- Less steep than WikiHow’s trendline.
---
### Key Observations
1. **WikiHow Dominates in Longer Texts**:
- WikiHow’s data points and trendline occupy the upper-right quadrant, suggesting longer texts (60–140) with higher mean log-likelihoods (-2 to -3).
2. **ActivityNet’s Shorter, Lower-Performing Texts**:
- ActivityNet’s data is concentrated in the lower-left quadrant (20–80 text length, -4 to -3 log-likelihood).
3. **Trendline Steepness**:
- WikiHow’s trendline is steeper, indicating a stronger relationship between text length and performance compared to ActivityNet.
4. **Legend Accuracy**:
- Green (WikiHow) and red (ActivityNet) markers align perfectly with their respective trendlines.
---
### Interpretation
- **Performance vs. Length**:
WikiHow’s texts are longer and achieve higher mean log-likelihoods, implying better quality or relevance in longer content. ActivityNet’s shorter texts underperform, possibly due to brevity or less structured guidance.
- **Trend Implications**:
Both sources show that longer texts correlate with improved performance, but WikiHow’s advantage is more pronounced. This could reflect differences in content design (e.g., WikiHow’s step-by-step guides vs. ActivityNet’s activity-based instructions).
- **Outliers/Anomalies**:
No significant outliers; data points align closely with trendlines.
The plot highlights WikiHow’s superiority in leveraging text length for higher performance, likely due to its structured, detailed approach.