## Radar Charts: Performance Comparison Across Benchmarks and Domains
### Overview
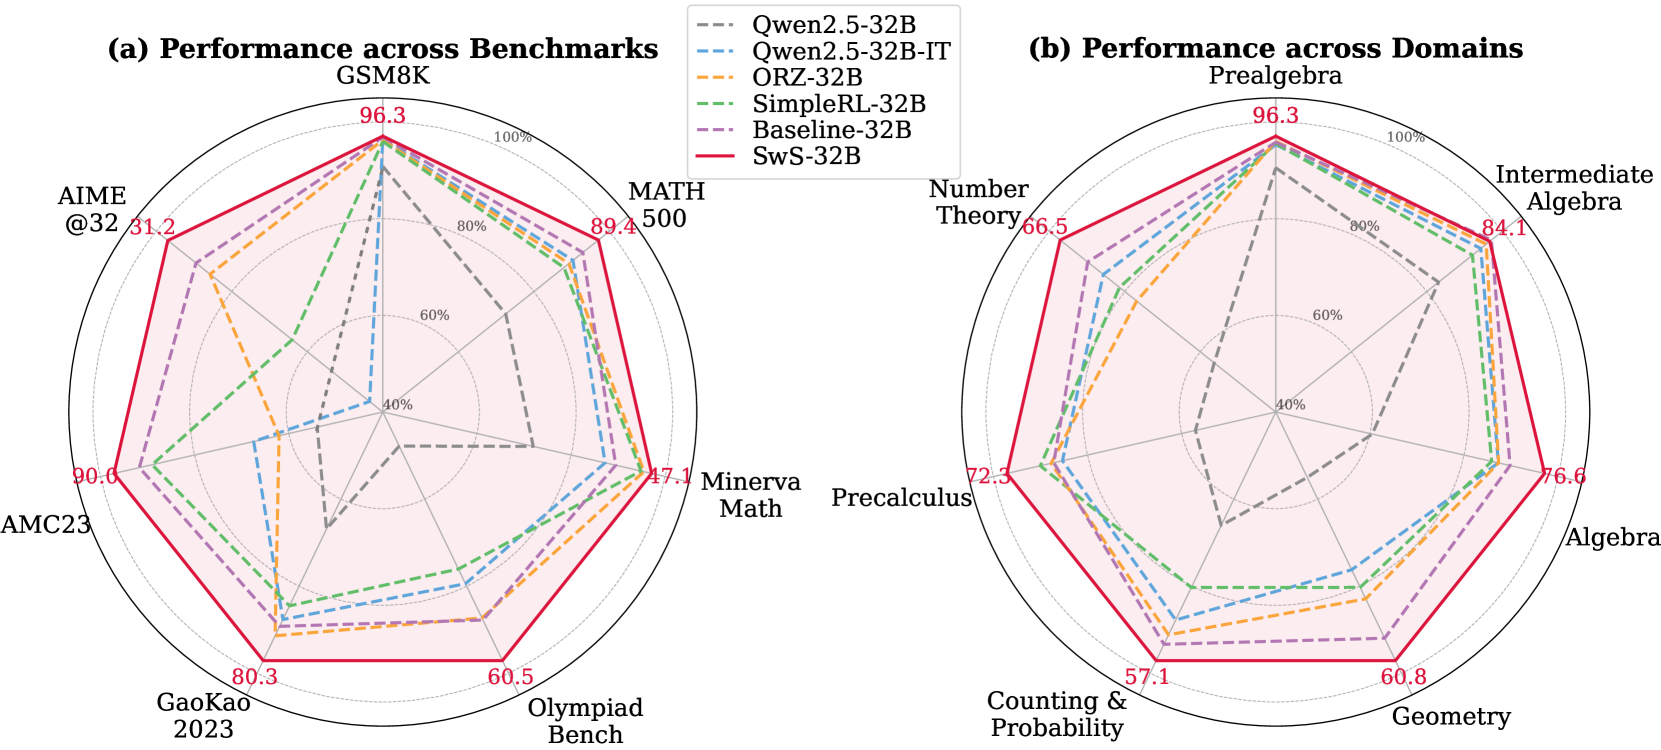
Two radar charts compare the performance of five AI models across different benchmarks (left) and academic domains (right). The charts use color-coded lines to represent models, with SwS-32B (red) consistently outperforming others in most categories.
### Components/Axes
**Legend (Top-Left of Both Charts):**
- Qwen2.5-32B (Gray dashed)
- Qwen2.5-32B-IT (Blue dashed)
- ORZ-32B (Orange dashed)
- SimpleRL-32B (Green dashed)
- Baseline-32B (Purple dashed)
- SwS-32B (Red solid)
**Chart (a) - Performance across Benchmarks:**
- **Axes (Clockwise from Top):**
1. GSM8K (96.3)
2. MATH (89.4)
3. AIME@32 (31.2)
4. AMC23 (90.0)
5. GaoKao 2023 (80.3)
6. Olympiad Bench (60.5)
7. Minerva Math (47.1)
**Chart (b) - Performance across Domains:**
- **Axes (Clockwise from Top):**
1. Prealgebra (96.3)
2. Intermediate Algebra (84.1)
3. Number Theory (66.5)
4. Precalculus (72.3)
5. Counting & Probability (57.1)
6. Geometry (60.8)
7. Algebra (76.6)
### Detailed Analysis
**Chart (a) Trends:**
- SwS-32B (Red) dominates all benchmarks, peaking at 96.3 (GSM8K) and maintaining >80% in 5/7 categories.
- Qwen2.5-32B-IT (Blue) shows strong performance in MATH (89.4) but struggles in Minerva Math (47.1).
- Baseline-32B (Purple) has the lowest scores, with 31.2 (AIME@32) and 60.5 (Olympiad Bench).
- ORZ-32B (Orange) and SimpleRL-32B (Green) show mid-tier performance, with ORZ-32B excelling in AMC23 (90.0).
**Chart (b) Trends:**
- SwS-32B maintains dominance, with 96.3 (Prealgebra) and 84.1 (Intermediate Algebra).
- Qwen2.5-32B-IT (Blue) performs best in Number Theory (66.5) but weakest in Geometry (60.8).
- Baseline-32B (Purple) scores lowest in Counting & Probability (57.1) and Geometry (60.8).
- ORZ-32B (Orange) shows consistent mid-range performance (72.3-84.1).
### Key Observations
1. **SwS-32B Superiority:** Red line consistently leads in both charts, suggesting it's optimized for these tasks.
2. **Qwen2.5-32B-IT Variability:** Blue line shows high variance (e.g., 89.4 in MATH vs. 47.1 in Minerva Math).
3. **Baseline-32B Weakness:** Purple line underperforms across all categories, indicating fundamental limitations.
4. **Domain-Specific Gaps:** Minerva Math (47.1) and Geometry (60.8) are weak points for most models.
### Interpretation
The data reveals SwS-32B as the most robust model across both benchmarks and academic domains, likely due to specialized training. Qwen2.5-32B-IT's performance suggests it excels in specific areas (e.g., MATH) but lacks generalization. The Baseline-32B's poor results highlight the importance of architectural complexity. Notably, Minerva Math and Geometry represent systemic challenges for current models, possibly due to insufficient training data or task complexity. These insights could guide targeted model improvements or domain-specific adaptations.