## Bar Chart: R1-Qwen | GPQA-D
### Overview
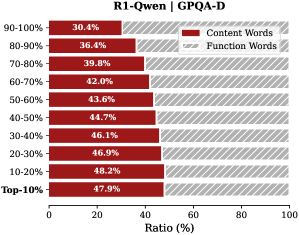
The chart compares the distribution of **Content Words** (red) and **Function Words** (gray with diagonal stripes) across different frequency ranges (90-100% to Top-10%). Each bar represents the percentage of words in a specific frequency bin, with values explicitly labeled on the bars.
### Components/Axes
- **X-axis**: "Ratio (%)" (0–100), representing the percentage of words in each frequency bin.
- **Y-axis**: Frequency ranges (90-100%, 80-90%, ..., Top-10%), ordered from highest to lowest frequency.
- **Legend**:
- Red: Content Words
- Gray (diagonal stripes): Function Words
- **Labels**:
- Chart title: "R1-Qwen | GPQA-D"
- Axis titles: "Ratio (%)" (x-axis), frequency ranges (y-axis)
- Data labels: Percentages on each bar (e.g., "30.4%" for Content Words in 90-100%).
### Detailed Analysis
- **Content Words (Red)**:
- 90-100%: 30.4%
- 80-90%: 36.4%
- 70-80%: 39.8%
- 60-70%: 42.0%
- 50-60%: 43.6%
- 40-50%: 44.7%
- 30-40%: 46.1%
- 20-30%: 46.9%
- 10-20%: 48.2%
- Top-10%: 47.9%
- **Function Words (Gray)**:
- Calculated as 100% minus Content Words for each bin (e.g., 69.6% in 90-100%, 63.6% in 80-90%).
### Key Observations
1. **Content Words** consistently increase as frequency decreases, peaking at 48.2% in the 10-20% range.
2. **Function Words** dominate in higher frequency bins (e.g., 69.6% in 90-100%) and decrease as frequency drops.
3. The **Top-10%** bin shows a slight decline in Content Words (47.9%) compared to the 10-20% bin (48.2%).
### Interpretation
The data suggests that **lower-frequency words** (e.g., 10-20%, Top-10%) are more likely to be **Content Words** (semantically meaningful terms), while **higher-frequency words** (e.g., 90-100%) are predominantly **Function Words** (grammatical/syntactic elements). This aligns with linguistic principles where function words (e.g., "and," "the") are typically more frequent, while content words (e.g., nouns, verbs) are less frequent but carry more meaning. The slight drop in Content Words in the Top-10% bin may reflect a smaller sample size or a natural distribution tail-off. The chart highlights a clear inverse relationship between word frequency and content-to-function word ratio.