## Chart Type: Pie Chart
### Overview
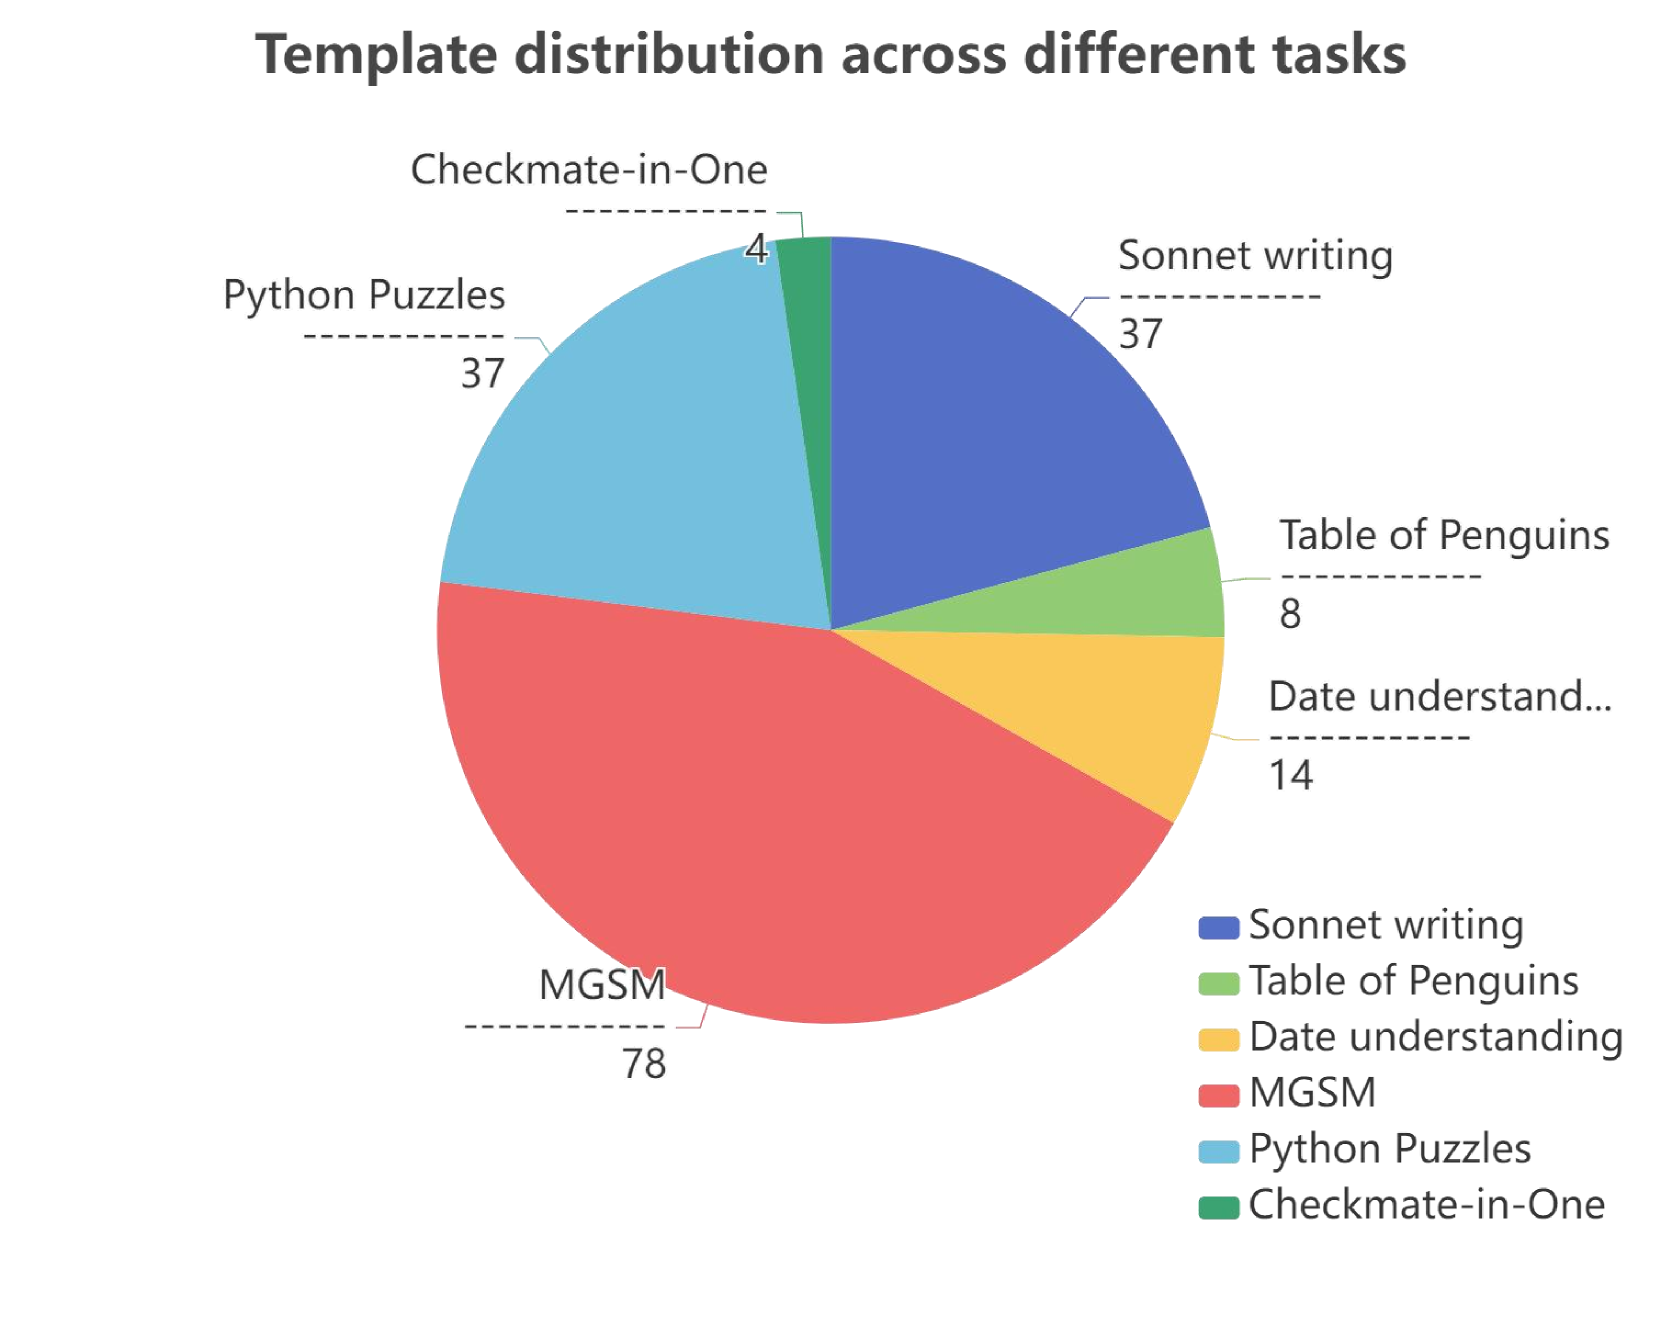
The image is a pie chart titled "Template distribution across different tasks". It shows the distribution of templates across six different tasks: Checkmate-in-One, Python Puzzles, Sonnet writing, Table of Penguins, Date understanding, and MGSM. Each slice of the pie represents the proportion of templates used for a specific task, with the corresponding numerical value displayed next to the task name.
### Components/Axes
* **Title:** Template distribution across different tasks
* **Categories:**
* Checkmate-in-One
* Python Puzzles
* Sonnet writing
* Table of Penguins
* Date understanding
* MGSM
* **Legend:** Located in the bottom-right corner, the legend maps each task to a specific color in the pie chart.
* Sonnet writing (Dark Blue)
* Table of Penguins (Light Green)
* Date understanding (Yellow)
* MGSM (Red)
* Python Puzzles (Light Blue)
* Checkmate-in-One (Dark Green)
### Detailed Analysis
The pie chart is divided into six slices, each representing a different task. The size of each slice corresponds to the proportion of templates used for that task. The numerical values associated with each task are as follows:
* **MGSM (Red):** 78
* **Python Puzzles (Light Blue):** 37
* **Sonnet writing (Dark Blue):** 37
* **Date understanding (Yellow):** 14
* **Table of Penguins (Light Green):** 8
* **Checkmate-in-One (Dark Green):** 4
### Key Observations
* MGSM has the largest share of the template distribution, with a value of 78.
* Python Puzzles and Sonnet writing have the same distribution, with a value of 37 each.
* Checkmate-in-One has the smallest share of the template distribution, with a value of 4.
### Interpretation
The pie chart illustrates the distribution of templates across different tasks. MGSM utilizes the most templates, suggesting it may be a more complex or frequently performed task. Checkmate-in-One uses the fewest templates, potentially indicating it is a simpler or less common task. The equal distribution between Python Puzzles and Sonnet writing suggests a similar level of template usage for these two tasks. The data provides insights into the relative complexity or frequency of different tasks based on template usage.