\n
## Pie Chart: Template Distribution Across Different Tasks
### Overview
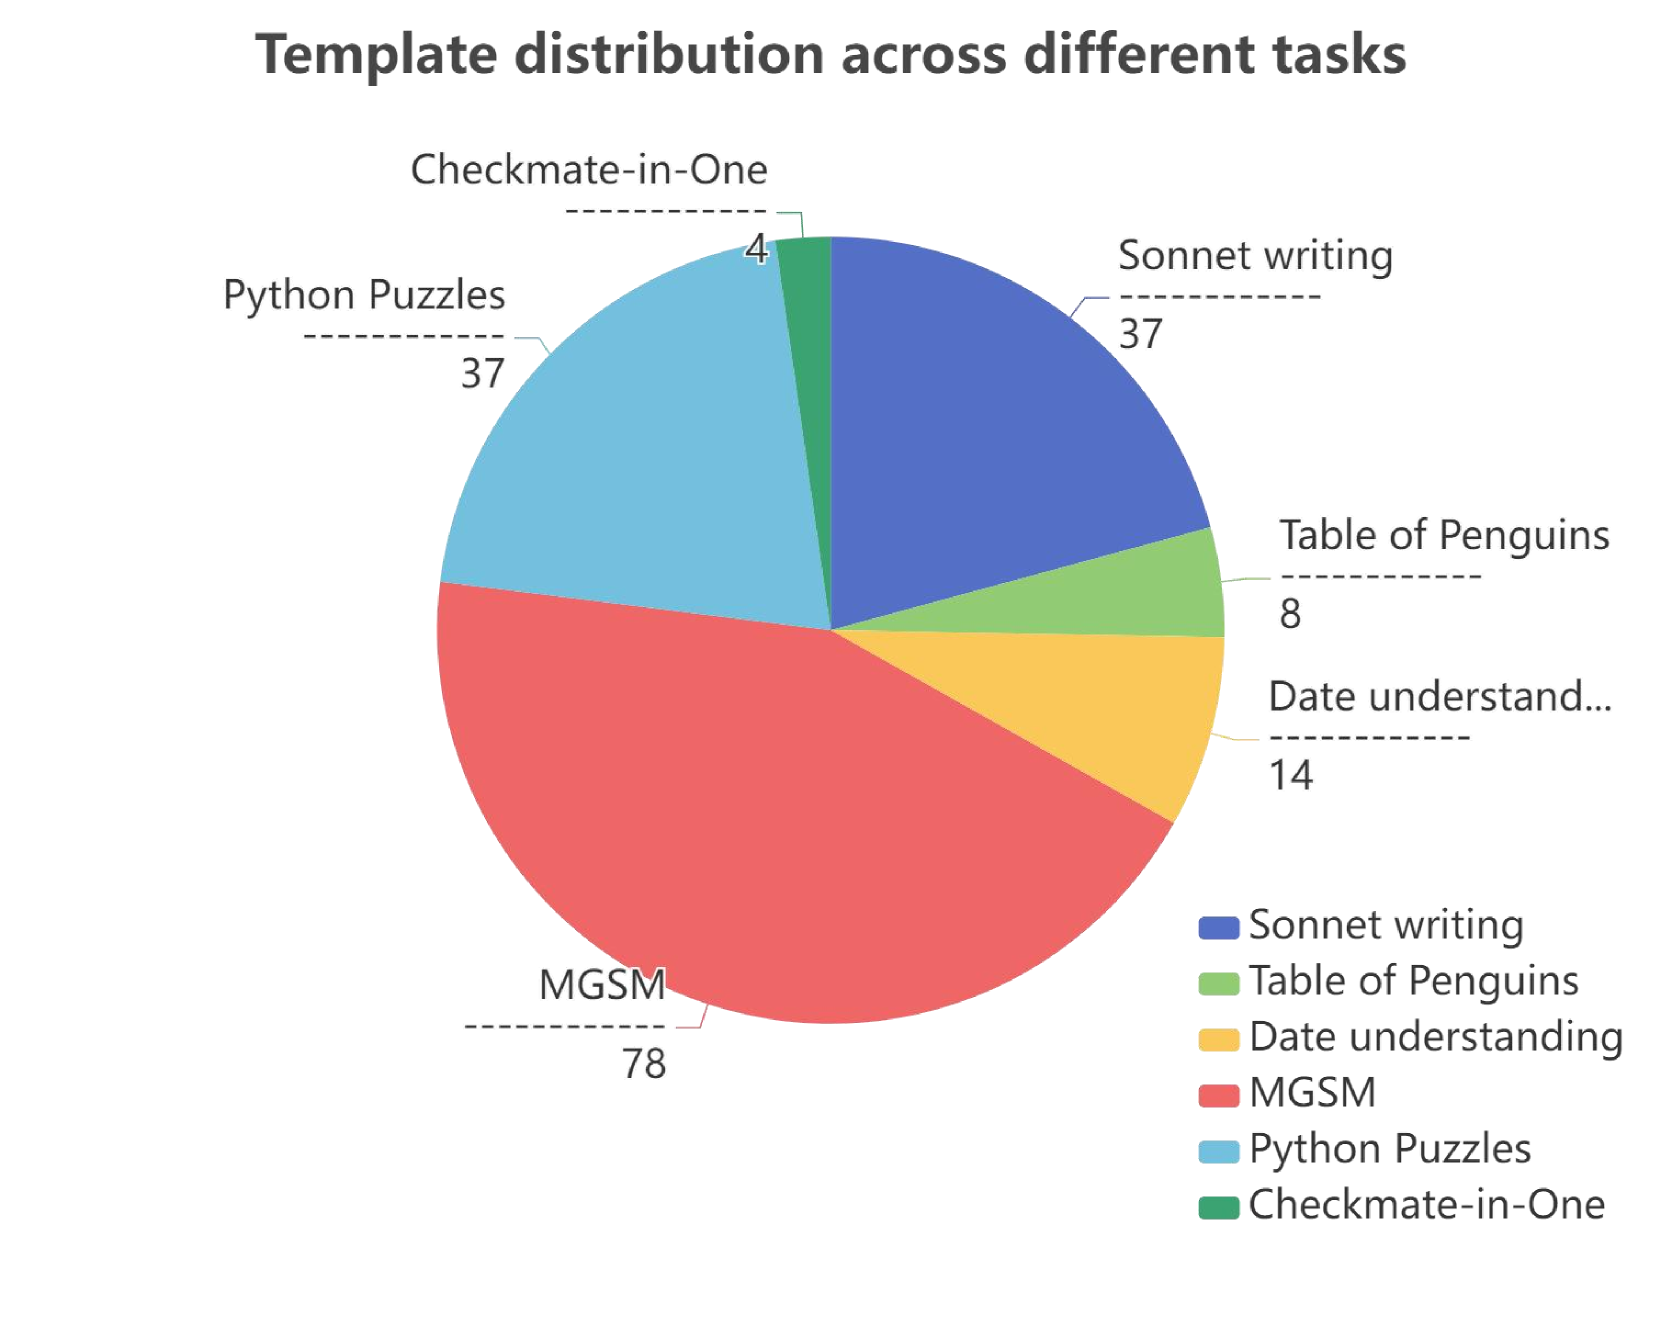
This image presents a pie chart illustrating the distribution of templates used across various tasks. The chart displays the proportion of each task represented by a slice of the pie, with labels indicating the task name and numerical values representing the count or percentage.
### Components/Axes
* **Title:** "Template distribution across different tasks" (positioned at the top-center)
* **Legend:** Located at the bottom-right of the chart. It maps colors to task names:
* Sonnet writing (Blue)
* Table of Penguins (Yellow)
* Date understanding (Orange)
* MGSM (Red)
* Python Puzzles (Light Blue)
* Checkmate-in-One (Green)
* **Pie Slices:** Each slice represents a task, with the size of the slice proportional to its value. Labels are positioned near each slice, indicating the task name and its corresponding value.
### Detailed Analysis
The pie chart shows the following distribution of templates across tasks:
* **MGSM:** 78 (Red slice, largest portion of the pie, located at the bottom)
* **Python Puzzles:** 37 (Light Blue slice, positioned to the left of MGSM)
* **Sonnet writing:** 37 (Blue slice, positioned at the top-left)
* **Date understanding:** 14 (Orange slice, positioned to the right of Sonnet writing)
* **Table of Penguins:** 8 (Yellow slice, positioned below Date understanding)
* **Checkmate-in-One:** 4 (Green slice, positioned between Python Puzzles and Table of Penguins)
### Key Observations
* MGSM constitutes the largest portion of the template distribution, accounting for approximately 49% of the total.
* Python Puzzles and Sonnet writing have the same count (37), representing approximately 23% each.
* Checkmate-in-One has the smallest representation, with only 4 templates used.
* The combined proportion of Date understanding, Table of Penguins, and Checkmate-in-One is relatively small compared to MGSM, Python Puzzles, and Sonnet writing.
### Interpretation
The data suggests that the MGSM task is the most prevalent, utilizing nearly half of the templates. Python Puzzles and Sonnet writing are also significant tasks, each accounting for a substantial portion of the template usage. The smaller counts for Date understanding, Table of Penguins, and Checkmate-in-One indicate that these tasks are less frequently addressed or require fewer templates.
The chart provides insight into the relative importance or frequency of different tasks within the context of template usage. This information could be valuable for resource allocation, task prioritization, or template development efforts. The large disparity between MGSM and other tasks suggests a potential focus area for further investigation – why is MGSM so dominant? Is it a particularly complex task, or is it simply the most common requirement? The relatively low usage of Checkmate-in-One might indicate a niche task or a need for more specialized templates.