## Chart: Average Correct Flips vs. Iteration
### Overview
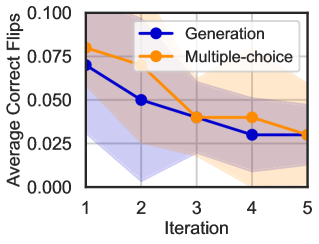
The image is a line chart comparing the average correct flips for two methods, "Generation" and "Multiple-choice," across five iterations. The chart shows the performance of each method over the iterations, with shaded regions indicating the variability or confidence intervals around the average values.
### Components/Axes
* **X-axis:** Iteration, labeled from 1 to 5.
* **Y-axis:** Average Correct Flips, ranging from 0.000 to 0.100.
* **Legend:** Located in the top-right corner.
* **Blue:** Generation
* **Orange:** Multiple-choice
### Detailed Analysis
* **Generation (Blue):**
* Trend: The line slopes downward, indicating a decrease in average correct flips as the iteration number increases.
* Data Points:
* Iteration 1: Approximately 0.070
* Iteration 2: Approximately 0.050
* Iteration 3: Approximately 0.040
* Iteration 4: Approximately 0.030
* Iteration 5: Approximately 0.030
* **Multiple-choice (Orange):**
* Trend: The line generally slopes downward, but less consistently than the "Generation" line.
* Data Points:
* Iteration 1: Approximately 0.080
* Iteration 2: Approximately 0.070
* Iteration 3: Approximately 0.040
* Iteration 4: Approximately 0.040
* Iteration 5: Approximately 0.030
### Key Observations
* Both methods show a decrease in average correct flips over the iterations.
* The "Generation" method starts lower than the "Multiple-choice" method but decreases more rapidly.
* By iteration 5, both methods converge to approximately the same average correct flips value.
### Interpretation
The chart suggests that both the "Generation" and "Multiple-choice" methods experience a decline in performance (as measured by average correct flips) as the iteration number increases. This could indicate that the task becomes more challenging or that the methods are not effectively adapting to the iterative process. The "Generation" method, while initially performing worse, converges to a similar performance level as the "Multiple-choice" method by the end of the iterations. The shaded regions around the lines likely represent the variance or confidence intervals, indicating the reliability of the average values.