\n
## Line Chart: Average Correct Flips vs. Iteration
### Overview
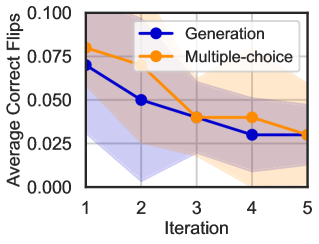
This image presents a line chart illustrating the relationship between the iteration number and the average number of correct flips for two different methods: "Generation" and "Multiple-choice". The chart also includes shaded regions representing the uncertainty or variance around each line.
### Components/Axes
* **X-axis:** Iteration, ranging from 1 to 5.
* **Y-axis:** Average Correct Flips, ranging from 0.000 to 0.100.
* **Data Series 1:** "Generation" - Represented by a blue line with circular markers.
* **Data Series 2:** "Multiple-choice" - Represented by an orange line with circular markers.
* **Legend:** Located in the top-right corner, identifying the two data series by color and name.
* **Shaded Regions:** Light blue and light orange areas surrounding each line, indicating the variance or confidence interval.
### Detailed Analysis
**Generation (Blue Line):**
The blue line representing "Generation" shows a decreasing trend from Iteration 1 to Iteration 5.
* Iteration 1: Approximately 0.073
* Iteration 2: Approximately 0.053
* Iteration 3: Approximately 0.042
* Iteration 4: Approximately 0.032
* Iteration 5: Approximately 0.025
**Multiple-choice (Orange Line):**
The orange line representing "Multiple-choice" also exhibits a decreasing trend, but with more fluctuation.
* Iteration 1: Approximately 0.078
* Iteration 2: Approximately 0.062
* Iteration 3: Approximately 0.048
* Iteration 4: Approximately 0.037
* Iteration 5: Approximately 0.027
**Shaded Regions:**
The shaded regions around each line indicate the uncertainty in the data. The width of the shaded region varies across iterations, suggesting differing levels of confidence in the average correct flips at each point. The light blue region is wider in the earlier iterations, indicating greater variance for the "Generation" method. The light orange region is also wider in the earlier iterations, indicating greater variance for the "Multiple-choice" method.
### Key Observations
* Both methods show a decreasing trend in average correct flips as the iteration number increases.
* At Iteration 1, the "Multiple-choice" method has a slightly higher average correct flips than the "Generation" method.
* The shaded regions suggest that the "Generation" method has a higher variance in its performance compared to the "Multiple-choice" method, particularly in the early iterations.
* The difference between the two methods appears to diminish as the iteration number increases.
### Interpretation
The data suggests that both the "Generation" and "Multiple-choice" methods become less effective at identifying correct flips as the number of iterations increases. This could indicate that the problem becomes more difficult to solve with each iteration, or that the methods are converging towards a suboptimal solution. The initial higher performance of the "Multiple-choice" method might suggest it is more robust or easier to apply in the early stages of the process. The decreasing performance of both methods could be due to overfitting, where the methods become too specialized to the initial data and lose their ability to generalize to new data. The shaded regions highlight the inherent uncertainty in the measurements, and suggest that further investigation with larger sample sizes or more refined methods is needed to draw more definitive conclusions. The chart demonstrates a clear trend of diminishing returns with increasing iterations for both methods.