## Line Graph: Average Correct Flips vs. Iteration
### Overview
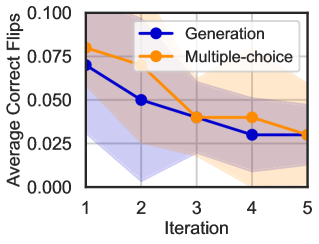
The image is a line graph comparing two methods ("Generation" and "Multiple-choice") across five iterations. The y-axis represents "Average Correct Flips" (0.000 to 0.100), and the x-axis represents "Iteration" (1 to 5). Shaded regions around each line indicate variability or confidence intervals.
### Components/Axes
- **X-axis (Iteration)**: Labeled "Iteration" with ticks at 1, 2, 3, 4, 5.
- **Y-axis (Average Correct Flips)**: Labeled "Average Correct Flips" with ticks at 0.000, 0.025, 0.050, 0.075, 0.100.
- **Legend**: Located in the top-right corner.
- **Blue line**: "Generation"
- **Orange line**: "Multiple-choice"
- **Shaded Regions**: Gray for "Generation" and beige for "Multiple-choice," centered on their respective lines.
### Detailed Analysis
1. **Generation (Blue Line)**:
- Iteration 1: ~0.075
- Iteration 2: ~0.050
- Iteration 3: ~0.040
- Iteration 4: ~0.030
- Iteration 5: ~0.025
- Trend: Steady decline with minimal fluctuation.
- Shaded region: Narrower at later iterations, indicating reduced variability.
2. **Multiple-choice (Orange Line)**:
- Iteration 1: ~0.075
- Iteration 2: ~0.080 (peak)
- Iteration 3: ~0.040
- Iteration 4: ~0.040
- Iteration 5: ~0.025
- Trend: Initial increase at iteration 2, followed by a sharp decline and stabilization.
- Shaded region: Broader at iteration 2, suggesting higher variability.
### Key Observations
- Both methods show a general decline in "Average Correct Flips" over iterations.
- "Multiple-choice" exhibits higher variability (wider shaded regions) compared to "Generation."
- "Generation" maintains a consistent downward trend, while "Multiple-choice" has a notable spike at iteration 2.
- Both lines converge at iteration 5 (~0.025), but "Generation" retains a narrower confidence interval.
### Interpretation
The data suggests that both "Generation" and "Multiple-choice" methods improve over time, but "Generation" demonstrates more stability and consistency. The spike in "Multiple-choice" at iteration 2 may indicate an outlier or a temporary performance boost, followed by a correction. The narrowing shaded regions for "Generation" imply that its results are more reliable as iterations progress. The convergence at iteration 5 could signal that both methods reach similar performance levels, but "Generation" achieves this with greater precision.