# Technical Document Extraction: Plugin Model Architecture
This document describes a technical diagram illustrating the architecture and data flow of a **Plugin Model** used for text generation or classification, specifically demonstrating how a reweighting mechanism influences the output of a black-box model.
## 1. Component Isolation
The diagram is structured into three primary horizontal regions:
* **Input (Left):** A document icon representing the initial text prompt.
* **Main Processing Block (Center):** A light purple rounded rectangle labeled "Plugin Model" containing the core logic.
* **Output & Feedback (Right):** The resulting text and a feedback loop for the next inference step.
---
## 2. Detailed Component Analysis
### A. Input Stage
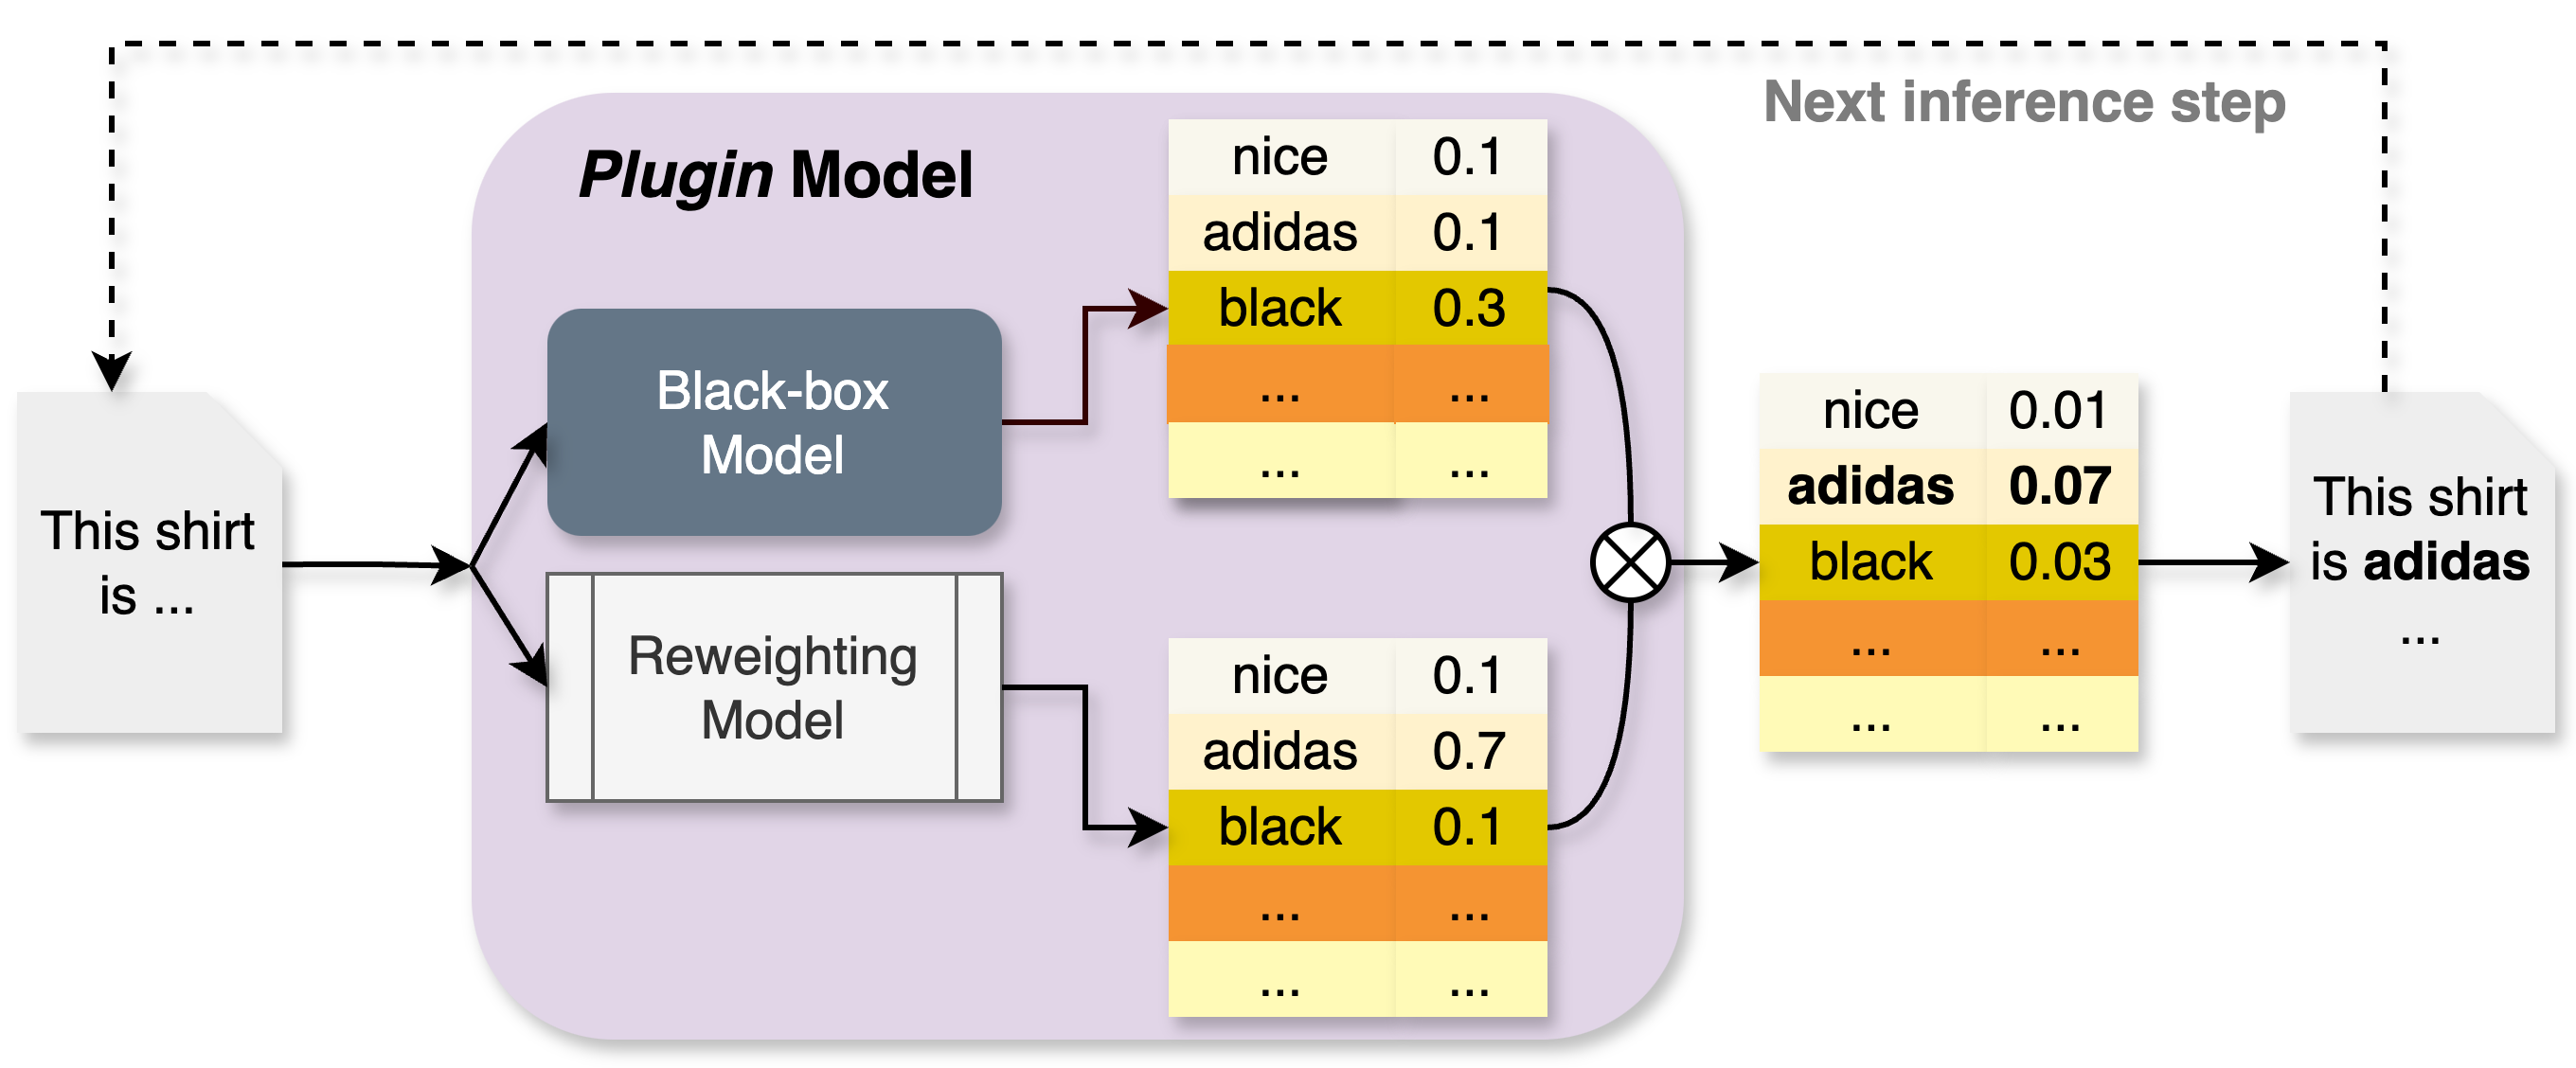
* **Text Prompt:** A document icon contains the text: `"This shirt is ..."`
* **Flow:** An arrow leads from the input into the Plugin Model, where it splits into two parallel processing paths.
### B. Plugin Model (Internal Components)
The Plugin Model consists of two sub-models that process the input simultaneously:
1. **Black-box Model:**
* **Visual:** Represented by a dark grey rectangular block.
* **Output:** A probability distribution table (Table 1).
2. **Reweighting Model:**
* **Visual:** Represented by a white rectangular block with vertical bars on the sides.
* **Output:** A probability distribution table (Table 2).
### C. Data Tables (Probability Distributions)
The diagram uses three tables to show how values are combined. Each table contains a list of tokens and their associated numerical weights.
| Token | Table 1 (Black-box) | Table 2 (Reweighting) | Table 3 (Combined Output) |
| :--- | :--- | :--- | :--- |
| **nice** | 0.1 | 0.1 | 0.01 |
| **adidas** | 0.1 | 0.7 | **0.07** |
| **black** | 0.3 | 0.1 | 0.03 |
| **...** | ... | ... | ... |
* **Visual Coding:** In all tables, the row for "black" is highlighted in yellow, and the row for "..." is highlighted in orange.
---
## 3. Process Flow and Logic
### Step 1: Parallel Inference
The input prompt is fed into both the **Black-box Model** and the **Reweighting Model**.
* The Black-box Model predicts "black" as the most likely next token (0.3).
* The Reweighting Model strongly favors "adidas" (0.7).
### Step 2: Multiplication Operation
The outputs from both tables are combined using a mathematical operation represented by a **circled 'X' (multiplication symbol)**.
* **Trend Verification:** The final value is the product of the two previous values (e.g., $0.1 \times 0.7 = 0.07$). This operation shifts the highest probability from "black" to "adidas".
### Step 3: Final Output Generation
* The combined table (Table 3) identifies **adidas** (0.07) as the winning token (indicated by bold text).
* **Resulting Text:** A document icon on the right shows the completed sentence: `"This shirt is adidas ..."`
### Step 4: Iterative Feedback
* **Label:** "Next inference step"
* **Flow:** A dashed line with an arrow loops from the final output back to the initial input document. This indicates that the generated word "adidas" is appended to the prompt for the next cycle of generation.
---
## 4. Summary of Data Points
* **Primary Language:** English.
* **Key Entities:** Black-box Model, Reweighting Model, Plugin Model.
* **Numerical Values:** 0.1, 0.3, 0.7, 0.01, 0.07, 0.03.
* **Keywords:** nice, adidas, black.