## Combined Plots: Harmonic Injection Analysis
### Overview
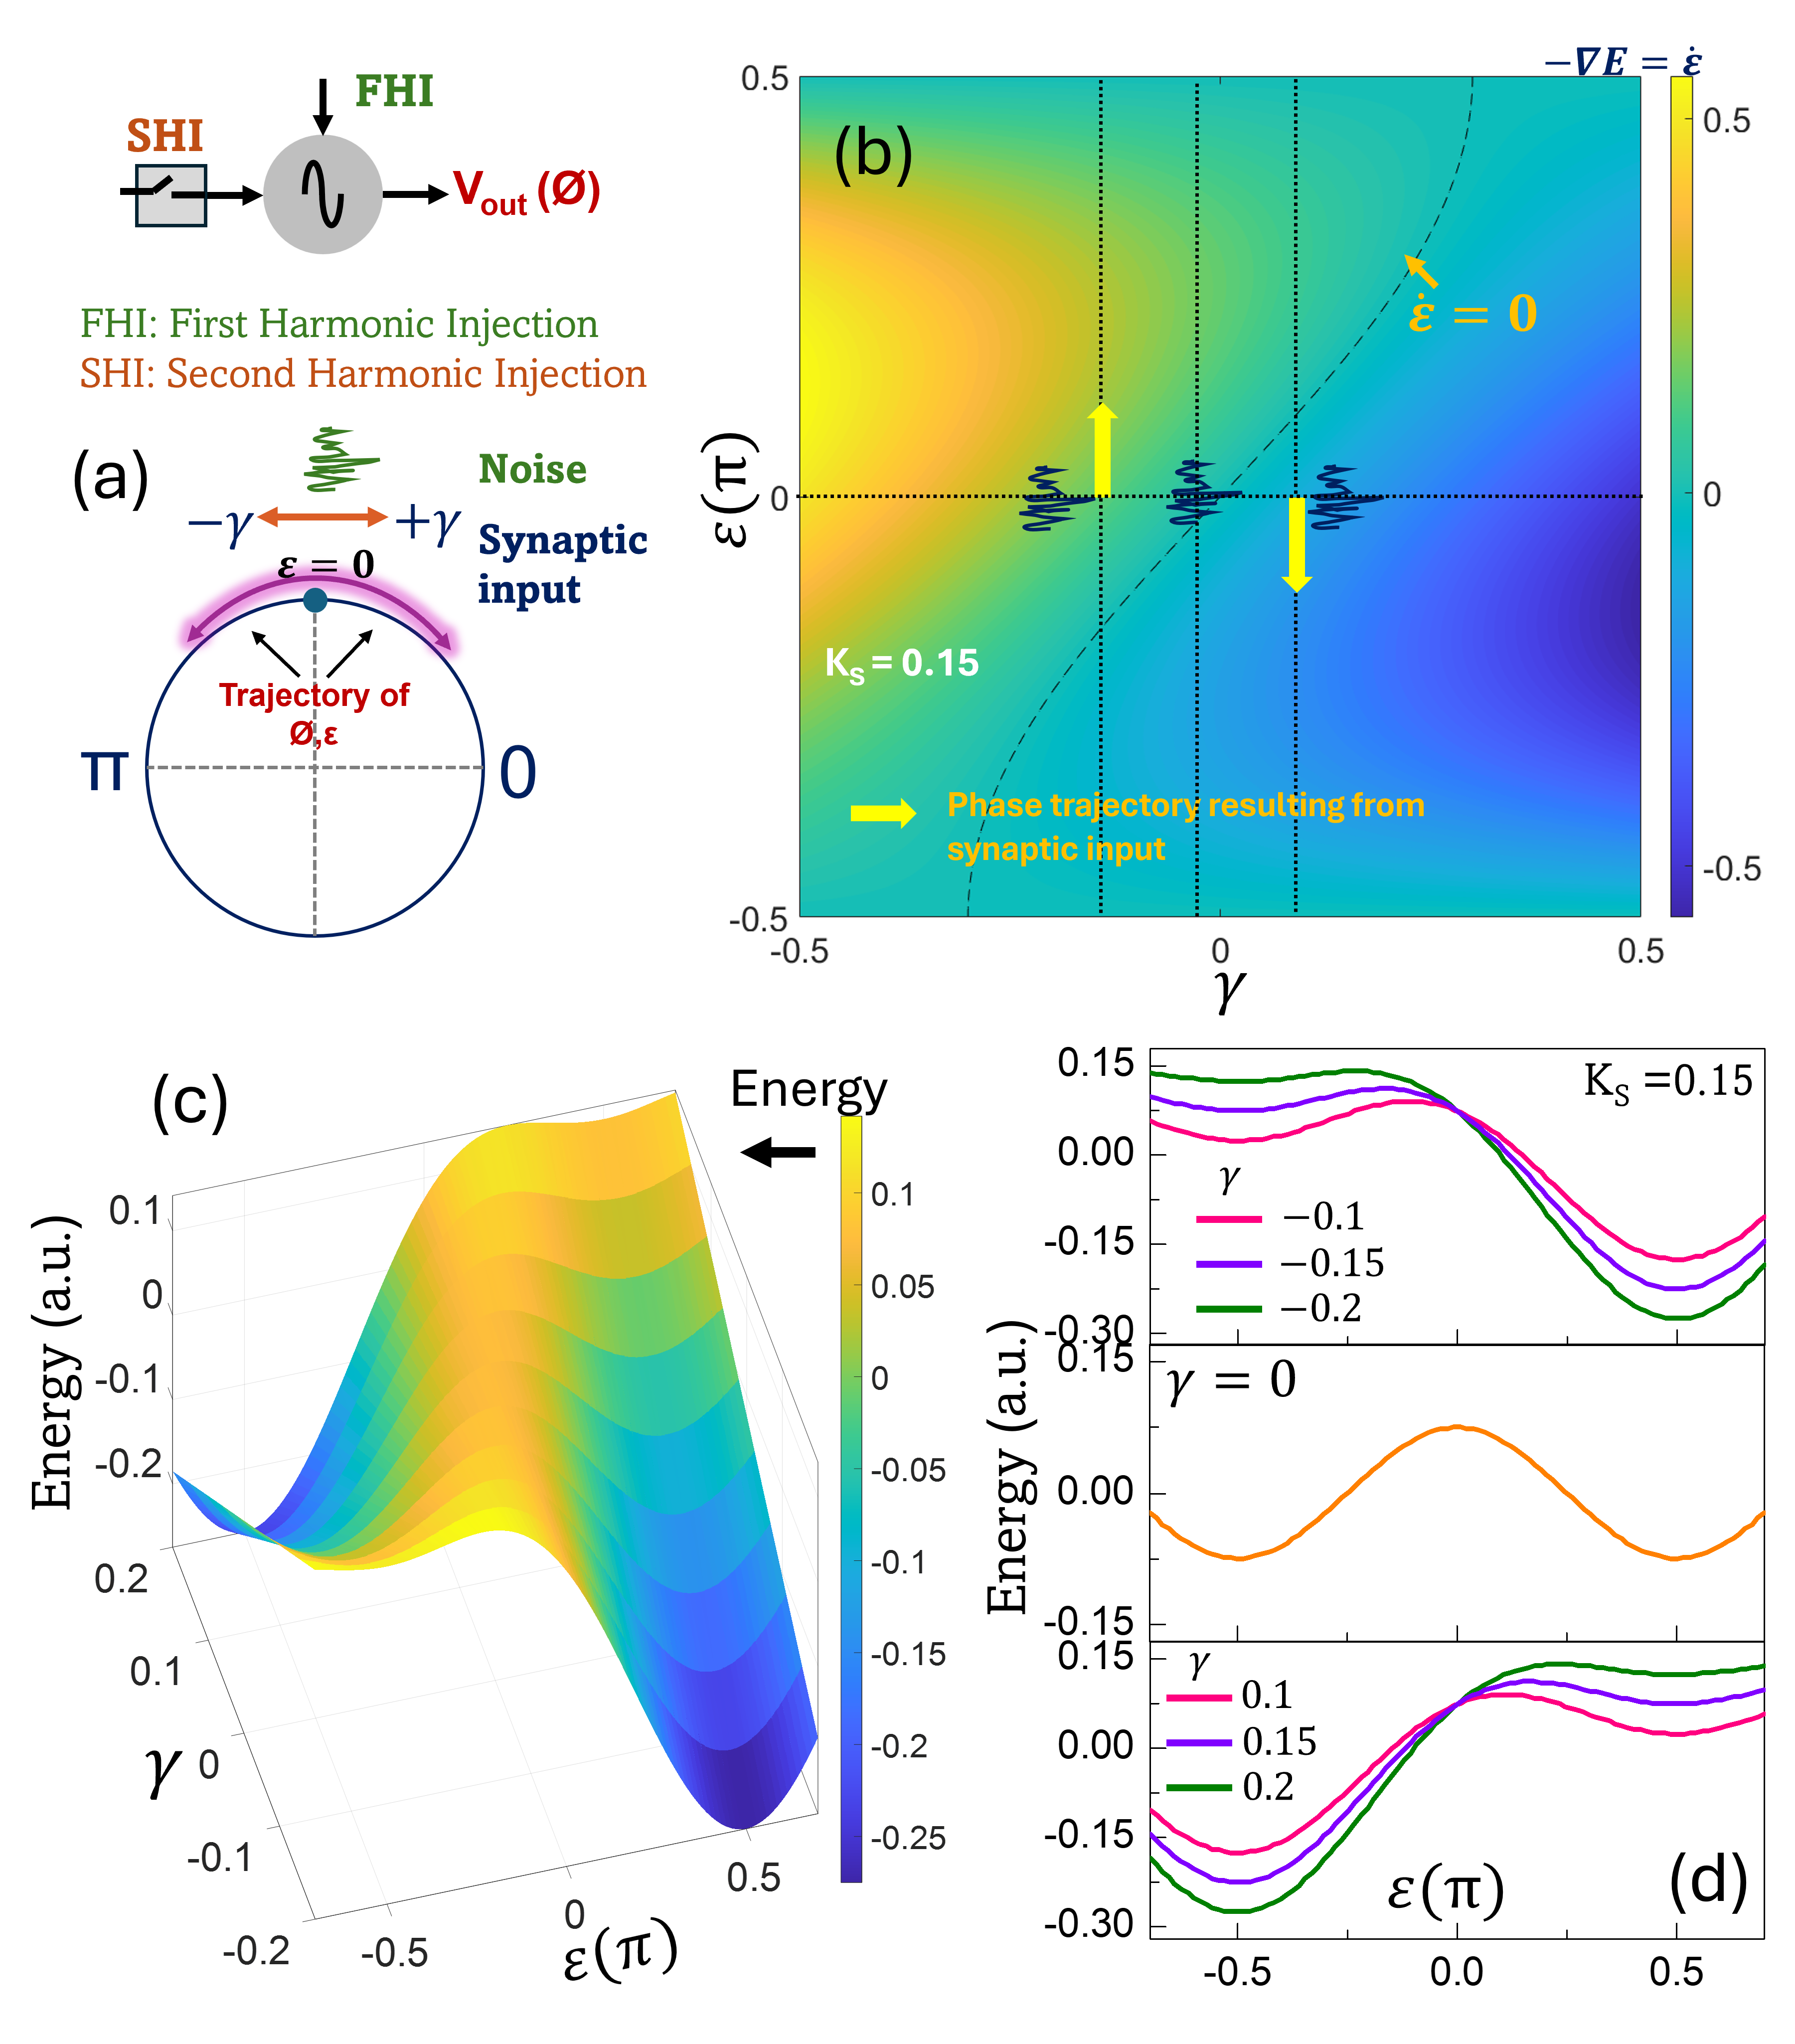
The image presents a series of plots analyzing harmonic injection, including a circuit diagram, phase trajectory, energy landscape, and energy profiles. The plots explore the relationship between parameters like gamma (γ), epsilon (ε), and energy.
### Components/Axes
**Plot (a): Circuit Diagram and Phase Trajectory**
* **Circuit Diagram:** Shows a block labeled "SHI" (Second Harmonic Injection) connected to a sinusoidal wave generator labeled "FHI" (First Harmonic Injection), with an output Vout(Ø).
* **Phase Trajectory:** A circular plot representing the trajectory of Ø,ε. The circle is marked with π on the left and 0 on the right. A blue dot indicates ε = 0. Arrows indicate the direction of the trajectory. The plot also shows the effect of noise and synaptic input, with arrows indicating -γ and +γ.
**Plot (b): Heatmap of -∇E = ε̇**
* **X-axis:** γ, ranging from -0.5 to 0.5.
* **Y-axis:** ε(π), ranging from -0.5 to 0.5.
* **Color Scale:** Represents -∇E = ε̇, ranging from approximately -0.5 (dark blue) to 0.5 (yellow).
* **Annotations:** Includes a dashed line indicating ε̇ = 0, a yellow arrow indicating the phase trajectory resulting from synaptic input, and the label Ks = 0.15. Vertical dotted lines are present at approximately γ = -0.15 and γ = 0.15.
**Plot (c): 3D Energy Landscape**
* **X-axis:** ε(π), ranging from approximately -0.2 to 0.5.
* **Y-axis:** γ, ranging from approximately -0.2 to 0.2.
* **Z-axis:** Energy (a.u.), ranging from -0.25 to 0.1.
* **Color Scale:** Represents energy, ranging from approximately -0.25 (blue) to 0.1 (yellow).
**Plot (d): Energy Profiles**
* **X-axis:** ε(π), ranging from -0.5 to 0.5.
* **Y-axis:** Energy (a.u.), ranging from -0.30 to 0.15.
* **Subplots:** Three subplots representing different values of γ.
* Top subplot: Ks = 0.15, with γ = -0.1 (pink), γ = -0.15 (purple), and γ = -0.2 (green).
* Middle subplot: γ = 0 (orange).
* Bottom subplot: γ = 0.1 (pink), γ = 0.15 (purple), and γ = 0.2 (green).
### Detailed Analysis or ### Content Details
**Plot (a):**
* The phase trajectory shows a circular path, indicating the cyclical nature of the system. The synaptic input influences the trajectory, shifting it along the γ axis.
**Plot (b):**
* The heatmap shows the relationship between γ, ε, and -∇E = ε̇. The region around ε̇ = 0 (dashed line) represents stable states. The phase trajectory arrow indicates the system's movement in response to synaptic input.
* The color gradient indicates the rate of change of ε (ε̇) with respect to the energy gradient (-∇E). Yellow regions indicate high positive values, while blue regions indicate high negative values.
**Plot (c):**
* The 3D energy landscape shows a potential well, with the minimum energy point representing a stable state. The shape of the well is influenced by both γ and ε.
* The energy surface has a clear minimum, suggesting a stable equilibrium point for the system.
**Plot (d):**
* The energy profiles show how energy varies with ε for different values of γ. The curves shift and change shape depending on γ.
* For Ks = 0.15, as γ decreases from -0.1 to -0.2, the energy minimum shifts downward.
* For γ = 0, the energy profile is a symmetrical curve.
* For positive γ values (0.1, 0.15, 0.2), the energy profiles show a similar trend to the negative γ values, with the energy minimum shifting downward as γ increases.
### Key Observations
* The system exhibits a stable state characterized by a minimum energy point.
* Synaptic input (γ) influences the phase trajectory and energy landscape.
* The energy profiles show how the energy landscape changes with different values of γ.
### Interpretation
The plots provide a comprehensive analysis of a system influenced by harmonic injection and synaptic input. The heatmap shows the dynamics of the system, with the phase trajectory indicating how the system evolves over time. The energy landscape and profiles provide insights into the stability and behavior of the system under different conditions. The data suggests that the system has a stable equilibrium point that can be influenced by external factors like synaptic input. The relationship between γ, ε, and energy is crucial in understanding the system's behavior and stability.