## Multi-Panel Technical Figure: Phase Dynamics with Harmonic Injection, Synaptic Input, and Energy Landscapes
### Overview
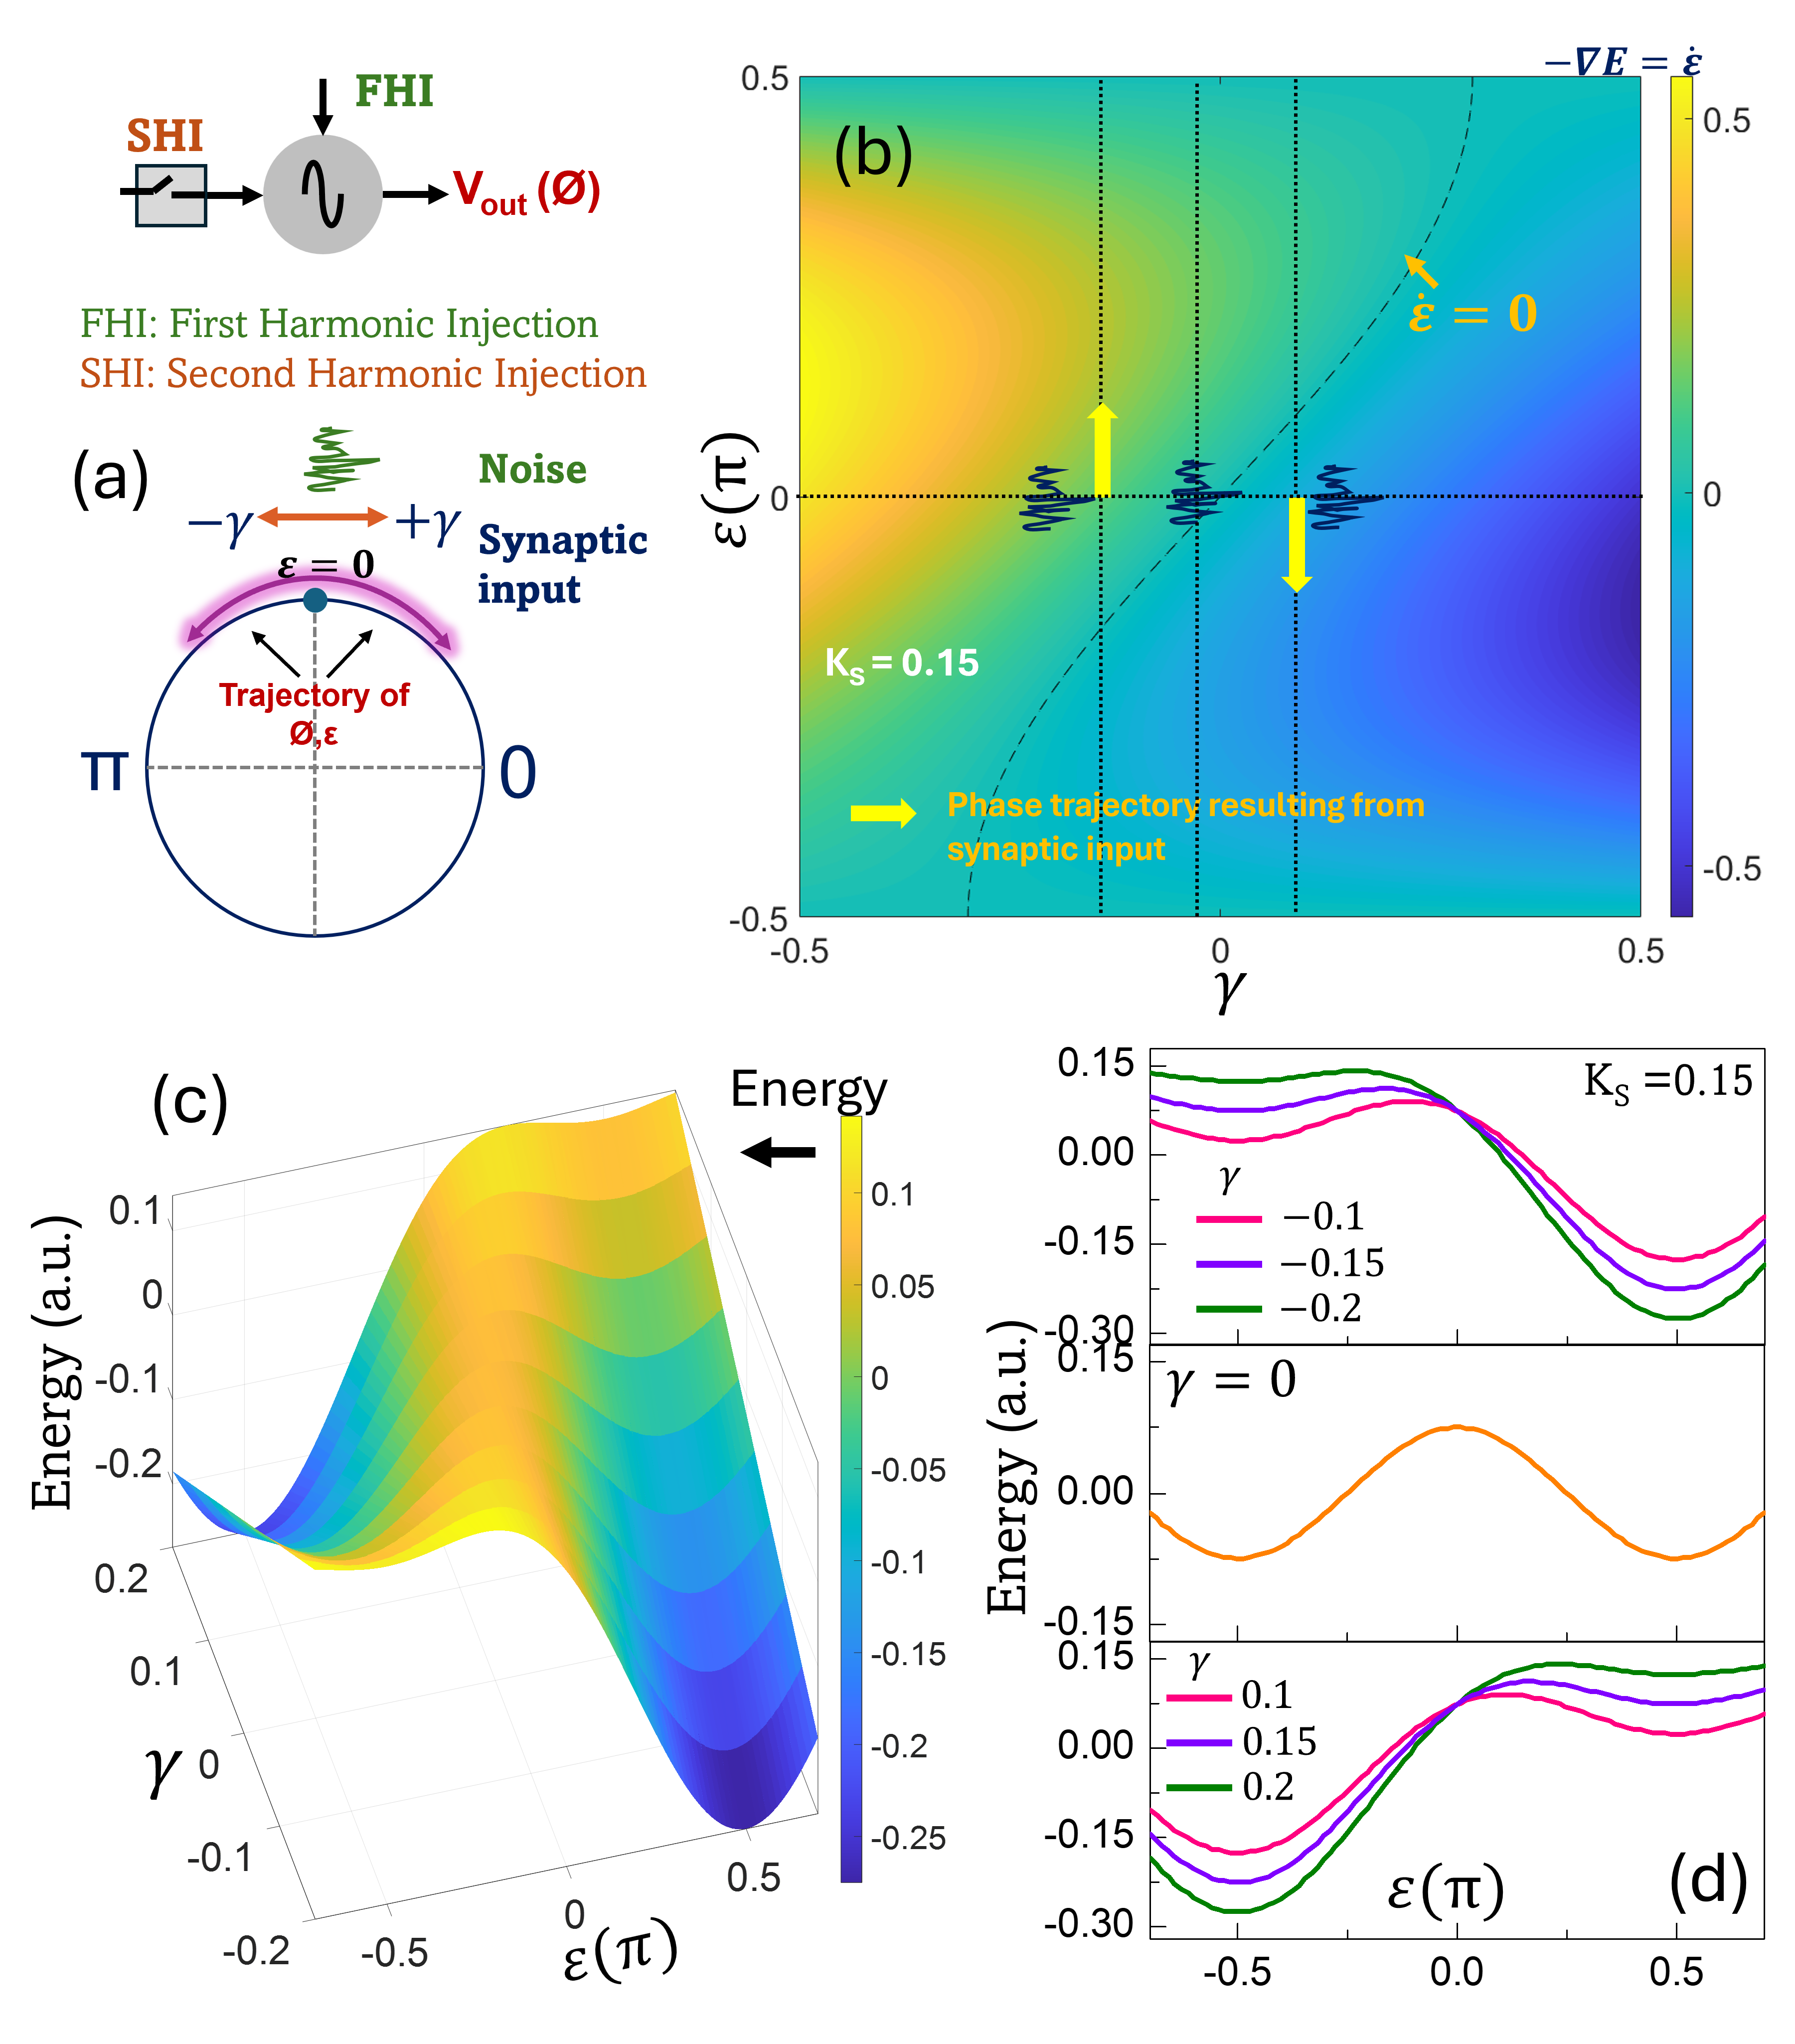
This image is a 4-panel technical figure (labeled a–d) illustrating phase dynamics in a system involving harmonic injection, synaptic input, noise, and energy landscapes. It combines schematic diagrams, a 2D heatmap, a 3D energy surface plot, and 2D energy vs. phase plots to characterize system behavior.
### Components/Axes
#### Panel (a): Schematic Diagram
- **Block Diagram (Top Left)**:
- Components: Square labeled "SHI" (Second Harmonic Injection) → circular oscillator → output labeled "V_out(∅)".
- Annotations: Downward arrow labeled "FHI" (First Harmonic Injection) into the oscillator.
- Text below: "FHI: First Harmonic Injection"; "SHI: Second Harmonic Injection".
- **Phase Diagram (Bottom)**:
- Circular phase space with ∅ (phase) marked from 0 to π (dashed lines).
- Blue dot at ε=0 (ε = phase difference/error).
- Synaptic input: Orange arrows labeled "-γ" (left) and "+γ" (right).
- Noise: Green wavy line labeled "Noise" above the phase circle.
- Trajectory: Pink arc labeled "Trajectory of ∅,ε" around the blue dot.
#### Panel (b): 2D Heatmap (Phase Dynamics)
- **Axes**:
- X-axis: γ (range: -0.5 to 0.5).
- Y-axis: ε(π) (range: -0.5 to 0.5).
- **Color Bar (Right)**:
- Label: "-∇E = ε̇" (time derivative of ε).
- Range: -0.5 (blue) to 0.5 (yellow).
- **Annotations**:
- Dashed line labeled "ε̇=0" (yellow arrow points to it).
- Text: "K_s=0.15" (bottom left).
- Yellow arrows labeled "Phase trajectory resulting from synaptic input" (two arrows, one upward, one downward, with noise wiggles).
#### Panel (c): 3D Energy Surface Plot
- **Axes**:
- X-axis: γ (range: -0.2 to 0.2).
- Y-axis: ε(π) (range: -0.5 to 0.5).
- Z-axis: Energy (a.u., range: -0.25 to 0.1).
- **Color Bar (Right)**:
- Label: "Energy (a.u.)".
- Range: -0.25 (blue) to 0.1 (yellow).
#### Panel (d): 2D Energy vs. Phase Plots (Stacked)
- **Axes (All Plots)**:
- X-axis: ε(π) (range: -0.5 to 0.5).
- Y-axis: Energy (a.u., range: -0.30 to 0.15).
- **Top Plot**:
- Label: "K_s=0.15".
- Legend: γ = -0.1 (pink), -0.15 (purple), -0.2 (green).
- **Middle Plot**:
- Label: "γ=0" (orange line).
- **Bottom Plot**:
- Legend: γ = 0.1 (pink), 0.15 (purple), 0.2 (green).
### Detailed Analysis
#### Panel (a) Schematic
- The block diagram models a system with two harmonic injections (FHI, SHI) and a phase-dependent output V_out(∅).
- The phase diagram shows synaptic input (±γ) and noise perturbing the phase trajectory around ε=0.
#### Panel (b) Heatmap
- **Trend Verification**: The heatmap shows ε̇ (color) as a function of γ and ε. The dashed line ε̇=0 divides regions where ε increases (yellow, ε̇>0) and decreases (blue, ε̇<0).
- **Spatial Grounding**: Yellow arrows (synaptic input trajectories) align with vertical dashed lines, indicating phase shifts induced by synaptic input.
#### Panel (c) 3D Energy Surface
- **Trend Verification**: Energy (z-axis) varies with γ and ε. Higher energy (yellow) occurs at γ ≈ 0 and ε ≈ 0; lower energy (blue) occurs at γ ≈ ±0.2 and ε ≈ ±0.5.
#### Panel (d) Line Plots
- **Top Plot (Negative γ)**: For γ = -0.1, -0.15, -0.2, energy peaks at ε=0 and dips at ε=±0.5.
- **Middle Plot (γ=0)**: Energy peaks at ε=0 and dips at ε=±0.5 (symmetric).
- **Bottom Plot (Positive γ)**: For γ = 0.1, 0.15, 0.2, energy dips at ε=0 and peaks at ε=±0.5 (opposite of negative γ).
### Key Observations
1. **Phase Trajectory Symmetry**: Synaptic input (±γ) induces symmetric phase shifts (Panel b).
2. **Energy Landscape Symmetry**: Energy vs. ε is symmetric around ε=0 for γ=0 (Panel d, middle).
3. **γ-Dependent Energy Inversion**: Negative γ causes energy peaks at ε=0; positive γ causes energy dips at ε=0 (Panel d, top vs. bottom).
4. **Noise Impact**: Noise (Panel a) perturbs the phase trajectory, visible as wiggles in Panel b’s arrows.
### Interpretation
This figure characterizes a phase-based system (likely a neural oscillator or similar) where:
- **Harmonic Injection (FHI/SHI)** modulates the oscillator’s output.
- **Synaptic Input (±γ)** and **noise** perturb the phase trajectory (ε).
- **Energy Landscapes** (Panels c–d) show that γ controls the stability of phase states: negative γ stabilizes ε=0 (energy peak), while positive γ destabilizes it (energy dip).
The data suggests that synaptic input and harmonic injection can tune the system’s phase dynamics, with energy landscapes dictating stable/unstable phase states. This has implications for understanding oscillatory systems (e.g., neural circuits) where phase synchronization and energy stability are critical.