## Bar Chart: MetaQA 3-Hop Hit@1 Scores
### Overview
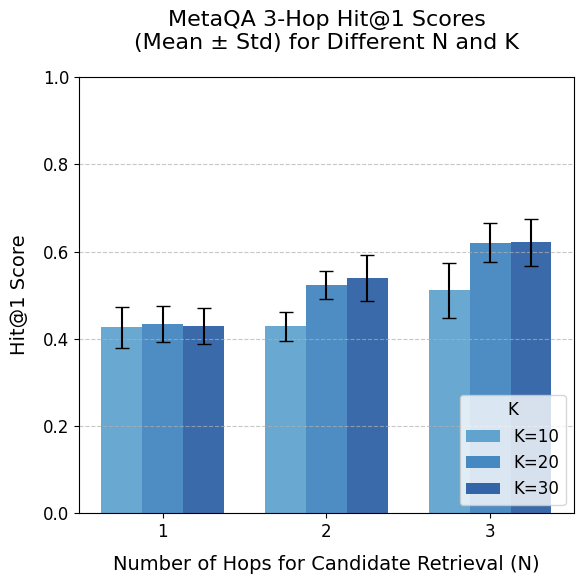
The image is a bar chart comparing MetaQA 3-Hop Hit@1 scores for different numbers of hops (N) and values of K. The chart displays the mean Hit@1 score with error bars representing the standard deviation. The x-axis represents the number of hops for candidate retrieval (N), and the y-axis represents the Hit@1 score. There are three sets of bars for each N value, corresponding to K=10, K=20, and K=30.
### Components/Axes
* **Title:** MetaQA 3-Hop Hit@1 Scores (Mean ± Std) for Different N and K
* **X-axis:** Number of Hops for Candidate Retrieval (N)
* Values: 1, 2, 3
* **Y-axis:** Hit@1 Score
* Values: 0.0, 0.2, 0.4, 0.6, 0.8, 1.0
* **Legend:** Located in the bottom-right corner.
* K=10 (light blue)
* K=20 (medium blue)
* K=30 (dark blue)
### Detailed Analysis
The chart presents Hit@1 scores for different configurations of N (number of hops) and K. For each value of N, there are three bars representing K=10, K=20, and K=30. Error bars indicate the standard deviation of the scores.
* **N=1:**
* K=10: Hit@1 score is approximately 0.43, with a standard deviation of approximately 0.05.
* K=20: Hit@1 score is approximately 0.43, with a standard deviation of approximately 0.05.
* K=30: Hit@1 score is approximately 0.43, with a standard deviation of approximately 0.05.
* **N=2:**
* K=10: Hit@1 score is approximately 0.43, with a standard deviation of approximately 0.04.
* K=20: Hit@1 score is approximately 0.53, with a standard deviation of approximately 0.04.
* K=30: Hit@1 score is approximately 0.54, with a standard deviation of approximately 0.06.
* **N=3:**
* K=10: Hit@1 score is approximately 0.51, with a standard deviation of approximately 0.07.
* K=20: Hit@1 score is approximately 0.62, with a standard deviation of approximately 0.05.
* K=30: Hit@1 score is approximately 0.62, with a standard deviation of approximately 0.06.
### Key Observations
* The Hit@1 score generally increases as the number of hops (N) increases.
* For N=2 and N=3, increasing K from 10 to 20 and 30 results in higher Hit@1 scores.
* The standard deviation appears relatively consistent across different N and K values.
* When N=1, the Hit@1 score is nearly identical for all values of K.
### Interpretation
The data suggests that increasing the number of hops (N) and the value of K generally improves the Hit@1 score for the MetaQA 3-Hop task. This indicates that retrieving candidates over multiple hops and considering a larger set of candidates (higher K) leads to better performance. The consistent standard deviation suggests that the observed trends are relatively stable. The fact that K has no impact when N=1 suggests that the value of K only becomes relevant when multiple hops are involved in the retrieval process.