## Bar Chart: MetaQA 3-Hop Hit@1 Scores (Mean ± Std) for Different N and K
### Overview
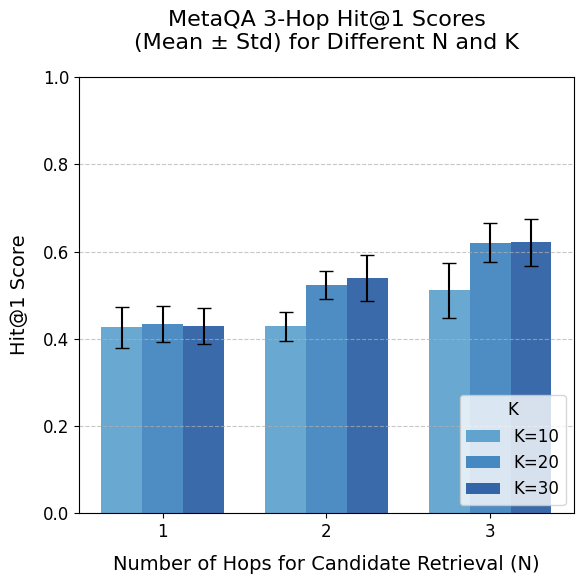
This is a grouped bar chart displaying the performance of a system on the MetaQA 3-Hop question answering task. The performance metric is the Hit@1 Score, presented as a mean value with error bars representing the standard deviation. The chart compares performance across two variables: the Number of Hops for Candidate Retrieval (N) and a parameter labeled K.
### Components/Axes
* **Chart Title:** "MetaQA 3-Hop Hit@1 Scores (Mean ± Std) for Different N and K"
* **Y-Axis:**
* **Label:** "Hit@1 Score"
* **Scale:** Linear, ranging from 0.0 to 1.0.
* **Major Ticks:** 0.0, 0.2, 0.4, 0.6, 0.8, 1.0.
* **Grid Lines:** Horizontal dashed lines at each major tick.
* **X-Axis:**
* **Label:** "Number of Hops for Candidate Retrieval (N)"
* **Categories:** Three discrete values: 1, 2, and 3.
* **Legend:**
* **Title:** "K"
* **Location:** Bottom-right corner of the plot area.
* **Categories & Colors:**
* `K=10`: Light blue (leftmost bar in each group).
* `K=20`: Medium blue (middle bar in each group).
* `K=30`: Dark blue (rightmost bar in each group).
* **Data Representation:** Grouped bars with error bars. Each group on the x-axis (N=1, N=2, N=3) contains three bars corresponding to K=10, K=20, and K=30.
### Detailed Analysis
**Data Points (Approximate Mean Values & Standard Deviation Ranges):**
* **N = 1:**
* **K=10 (Light Blue):** Mean ≈ 0.43. Error bar spans approximately 0.39 to 0.47.
* **K=20 (Medium Blue):** Mean ≈ 0.43. Error bar spans approximately 0.39 to 0.47.
* **K=30 (Dark Blue):** Mean ≈ 0.43. Error bar spans approximately 0.39 to 0.47.
* *Trend:* All three K values yield nearly identical performance at N=1.
* **N = 2:**
* **K=10 (Light Blue):** Mean ≈ 0.43. Error bar spans approximately 0.40 to 0.46.
* **K=20 (Medium Blue):** Mean ≈ 0.53. Error bar spans approximately 0.48 to 0.58.
* **K=30 (Dark Blue):** Mean ≈ 0.54. Error bar spans approximately 0.49 to 0.59.
* *Trend:* Performance for K=20 and K=30 increases notably compared to N=1, while K=10 remains flat. K=20 and K=30 are very close.
* **N = 3:**
* **K=10 (Light Blue):** Mean ≈ 0.51. Error bar spans approximately 0.45 to 0.57.
* **K=20 (Medium Blue):** Mean ≈ 0.62. Error bar spans approximately 0.58 to 0.66.
* **K=30 (Dark Blue):** Mean ≈ 0.62. Error bar spans approximately 0.57 to 0.67.
* *Trend:* Performance for all K values increases compared to N=2. K=20 and K=30 again show very similar, higher performance than K=10.
### Key Observations
1. **Positive Correlation with N:** For a fixed K (especially K=20 and K=30), the Hit@1 Score generally increases as the Number of Hops for Candidate Retrieval (N) increases from 1 to 3.
2. **Impact of K:** At N=1, the parameter K has no discernible effect on performance. At N=2 and N=3, higher K values (20 and 30) lead to significantly better performance than K=10. The difference between K=20 and K=30 is minimal across all N.
3. **Performance Plateau for K:** There appears to be a diminishing return or plateau in performance when increasing K from 20 to 30, as their mean scores and error bars overlap substantially at N=2 and N=3.
4. **Variability:** The standard deviation (error bars) is relatively consistent across most data points, suggesting similar levels of variance in the results, though it appears slightly larger for the N=3, K=10 data point.
### Interpretation
The data suggests that for the MetaQA 3-Hop task, increasing the depth of candidate retrieval (N) is beneficial for improving the accuracy of the top-ranked answer (Hit@1). This benefit is most pronounced when the system is allowed to consider a larger set of candidates (higher K).
The lack of difference between K values at N=1 implies that with only a single retrieval hop, the system's performance is bottlenecked by the initial retrieval step, and simply retrieving more candidates (increasing K) does not help. However, as the retrieval process becomes more complex (N=2 or 3), having a larger candidate pool (K=20 or 30) becomes crucial for achieving higher accuracy, likely because it provides more material for the multi-hop reasoning process to work with.
The near-identical performance of K=20 and K=30 indicates that beyond a certain point (K=20), adding more candidates does not yield further significant gains for this specific task and metric. This could point to an optimal resource-accuracy trade-off, where K=20 might be sufficient. The overall trend highlights the importance of multi-hop retrieval (N>1) combined with an adequately sized candidate set (K≥20) for effective performance on complex, multi-hop question answering.