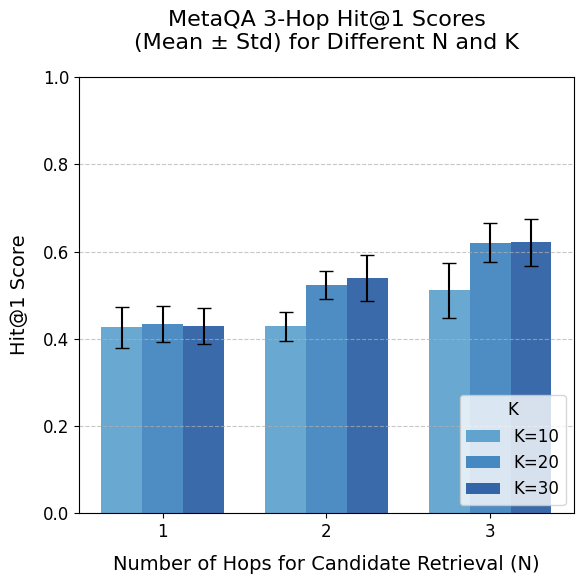
## Bar Chart: MetaQA 3-Hop Hit@1 Scores (Mean ± Std) for Different N and K
### Overview
The chart compares the performance of a retrieval system (measured by Hit@1 score) across different configurations of "Number of Hops for Candidate Retrieval (N)" and "K" (number of candidates). The y-axis represents the mean Hit@1 score with error bars indicating standard deviation. Three K values (10, 20, 30) are compared for N values of 1, 2, and 3.
### Components/Axes
- **X-axis**: "Number of Hops for Candidate Retrieval (N)" with categories 1, 2, 3.
- **Y-axis**: "Hit@1 Score" scaled from 0.0 to 1.0.
- **Legend**: Located at the bottom-right, mapping colors to K values:
- Light blue: K=10
- Medium blue: K=20
- Dark blue: K=30
- **Bars**: Grouped by N, with three bars per group (one per K value). Error bars extend vertically from each bar.
### Detailed Analysis
- **N=1**:
- K=10: ~0.42 (error bar ±0.03)
- K=20: ~0.43 (error bar ±0.03)
- K=30: ~0.44 (error bar ±0.03)
- **N=2**:
- K=10: ~0.45 (error bar ±0.04)
- K=20: ~0.52 (error bar ±0.04)
- K=30: ~0.54 (error bar ±0.04)
- **N=3**:
- K=10: ~0.50 (error bar ±0.05)
- K=20: ~0.60 (error bar ±0.05)
- K=30: ~0.62 (error bar ±0.05)
### Key Observations
1. **Increasing K improves performance**: For all N values, higher K (more candidates) correlates with higher Hit@1 scores.
2. **Increasing N improves performance**: Larger N (more hops) consistently yields better scores, especially at higher K values.
3. **Error variability**: Error bars grow larger as N increases, suggesting greater uncertainty in performance estimates for complex queries (N=3).
4. **Diminishing returns**: The performance gap between K=20 and K=30 narrows as N increases (e.g., N=3: K=20=0.60 vs. K=30=0.62).
### Interpretation
The data demonstrates that both increasing the number of retrieval hops (N) and the candidate pool size (K) enhance retrieval effectiveness. However, the benefits of expanding K are more impactful at higher N values, indicating that deeper search paths (more hops) amplify the value of larger candidate sets. The growing error bars for larger N suggest that while the system performs better on complex queries, its reliability decreases, potentially due to increased computational complexity or sparser data in deeper search spaces. This trade-off highlights the need to balance query complexity (N) with resource allocation (K) in retrieval system design.