\n
## Diagram: Global Fan-Out Illustration
### Overview
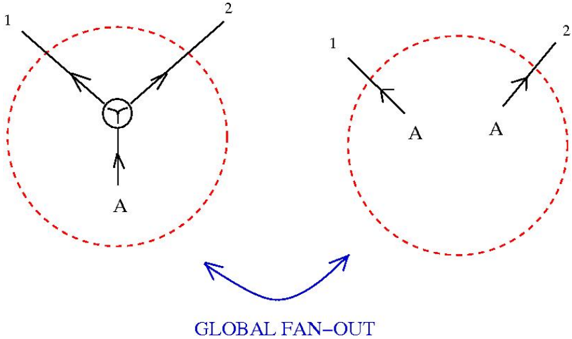
The image presents a diagram illustrating a concept labeled "GLOBAL FAN-OUT". It depicts two circular arrangements of nodes and connections, visually representing a transformation or distribution process. The left side shows a central node with multiple outgoing connections, while the right side shows a distribution of those connections to separate nodes.
### Components/Axes
The diagram consists of the following elements:
* **Circles:** Two dashed red circles, one on the left and one on the right, enclosing nodes and connections.
* **Nodes:** Represented by circles. The left side has a central node with a smaller, split node below it. The right side has two separate nodes.
* **Connections/Arrows:** Arrows indicating the flow or relationship between nodes.
* **Labels:**
* "1" - Labeling the top-left connection/node on both sides.
* "2" - Labeling the top-right connection/node on both sides.
* "A" - Labeling the bottom connection/node on both sides.
* **Text:** "GLOBAL FAN-OUT" - positioned below the two circular arrangements, with a curved blue arrow pointing from the left to the right.
### Detailed Analysis or Content Details
The diagram shows a transformation from a single point with multiple outputs to multiple points, each receiving a portion of the original outputs.
**Left Side:**
* A central node has three outgoing connections labeled 1, 2, and A.
* The central node has a smaller, split node below it, with a Y-shape.
* The connections 1, 2, and A originate from the central node.
**Right Side:**
* Two separate nodes are present.
* Connection 1 leads to the left node, labeled "A".
* Connection 2 leads to the right node, labeled "A".
* The connections 1 and 2 originate from outside the diagram, implied by the arrow.
The curved blue arrow indicates a directional flow from the left side to the right side.
### Key Observations
* The diagram visually represents a distribution or fan-out process.
* The label "GLOBAL FAN-OUT" suggests a broad or system-wide distribution.
* The "A" label appears on both sides, indicating a consistent element in the transformation.
* The split node on the left side suggests a branching or decision point before the fan-out occurs.
### Interpretation
The diagram illustrates the concept of "GLOBAL FAN-OUT," likely in a computing or networking context. It demonstrates how a single source (the central node on the left) can distribute its output to multiple destinations (the two nodes on the right). The split node on the left could represent a load balancer or a routing mechanism that determines how the output is distributed. The "A" label might represent a specific type of data or a common destination. The curved arrow emphasizes the direction of the distribution process.
The diagram is a simplified representation of a complex system, focusing on the core concept of distributing a signal or data stream. It doesn't provide specific numerical data or performance metrics, but rather a conceptual overview of the fan-out process. The diagram suggests a transformation where a centralized process is expanded into a distributed one.