## Line Chart: Validation Loss vs Training FLOPs
### Overview
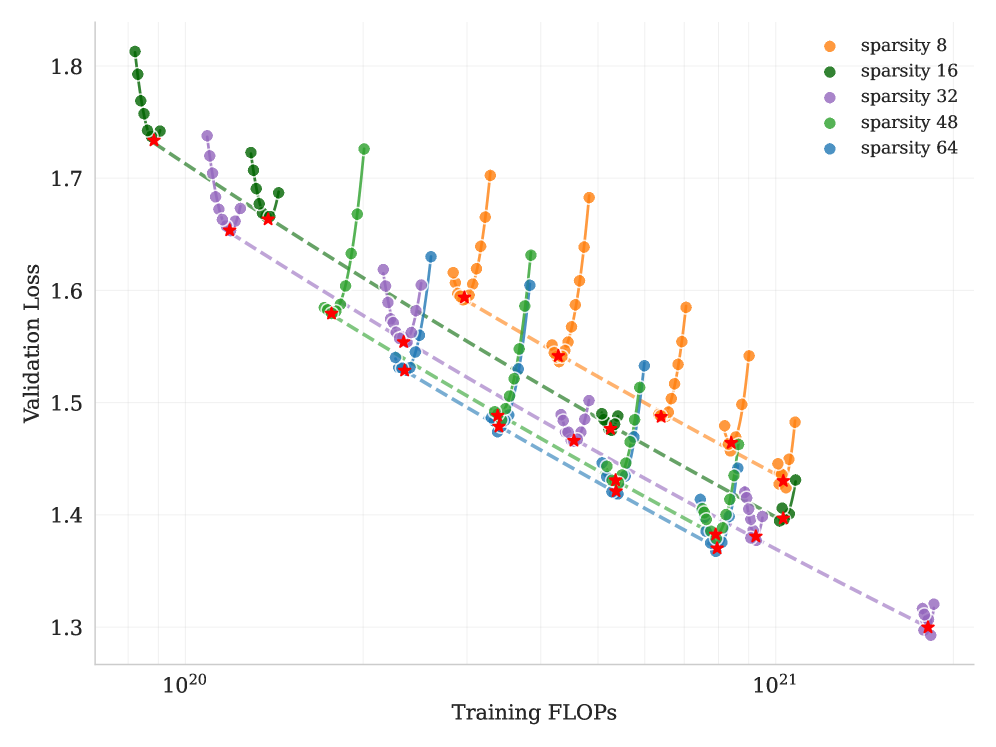
The chart visualizes the relationship between training computational effort (FLOPs) and validation loss across five sparsity levels (8, 16, 32, 48, 64). Each sparsity level is represented by a distinct color-coded line with data points, showing how validation loss evolves during training. Red stars mark the minimum validation loss for each sparsity level.
### Components/Axes
- **X-axis (Training FLOPs)**: Logarithmic scale from 10²⁰ to 10²¹.
- **Y-axis (Validation Loss)**: Linear scale from 1.3 to 1.8.
- **Legend**: Located in the top-right corner, mapping colors to sparsity levels:
- Orange: sparsity 8
- Green: sparsity 16
- Purple: sparsity 32
- Green: sparsity 48
- Blue: sparsity 64
- **Lines**: Dashed lines for each sparsity level, connecting data points.
- **Data Points**: Colored circles (matching legend) with red stars indicating minima.
### Detailed Analysis
1. **Sparsity 8 (Orange)**:
- Starts at ~1.75 (10²⁰ FLOPs), dips to ~1.65 (10²⁰.⁵ FLOPs), then rises to ~1.7 (10²¹ FLOPs).
- Minimum validation loss: **1.65** at ~10²⁰.⁵ FLOPs.
2. **Sparsity 16 (Green)**:
- Begins at ~1.78 (10²⁰ FLOPs), decreases to ~1.68 (10²⁰.² FLOPs), then increases to ~1.72 (10²¹ FLOPs).
- Minimum validation loss: **1.68** at ~10²⁰.² FLOPs.
3. **Sparsity 32 (Purple)**:
- Starts at ~1.75 (10²⁰ FLOPs), drops to ~1.62 (10²⁰.⁴ FLOPs), then rises to ~1.68 (10²¹ FLOPs).
- Minimum validation loss: **1.62** at ~10²⁰.⁴ FLOPs.
4. **Sparsity 48 (Green)**:
- Begins at ~1.72 (10²⁰ FLOPs), decreases to ~1.58 (10²⁰.³ FLOPs), then increases to ~1.64 (10²¹ FLOPs).
- Minimum validation loss: **1.58** at ~10²⁰.³ FLOPs.
5. **Sparsity 64 (Blue)**:
- Starts at ~1.7 (10²⁰ FLOPs), dips to ~1.55 (10²⁰.² FLOPs), then rises to ~1.6 (10²¹ FLOPs).
- Minimum validation loss: **1.55** at ~10²⁰.² FLOPs.
### Key Observations
- **Inverse Relationship**: Higher sparsity levels (e.g., 64) generally achieve lower validation loss minima compared to lower sparsity levels (e.g., 8), despite the latter having more parameters.
- **Optimal Training FLOPs**: Each sparsity level reaches its minimum validation loss at distinct FLOP thresholds (e.g., sparsity 64 at ~10²⁰.² FLOPs).
- **Fluctuations**: Data points show non-monotonic trends, with validation loss increasing after initial decreases for most sparsity levels.
### Interpretation
The data suggests that **higher sparsity correlates with better validation performance**, contradicting the intuitive expectation that reduced sparsity (more parameters) would improve model accuracy. This could indicate:
1. **Efficiency vs. Performance Tradeoff**: Higher sparsity may enable faster convergence or better generalization despite fewer parameters.
2. **Training Dynamics**: The minima for higher sparsity occur earlier in training (lower FLOPs), suggesting these models stabilize faster.
3. **Anomalies**: The green lines for sparsity 16 and 48 overlap in color but show distinct trends, highlighting potential ambiguities in legend labeling or data grouping.
The red stars emphasize that optimal performance for each sparsity level is achieved at specific training stages, guiding resource allocation for model training.