## Scatter Plot: Responses Distribution
### Overview
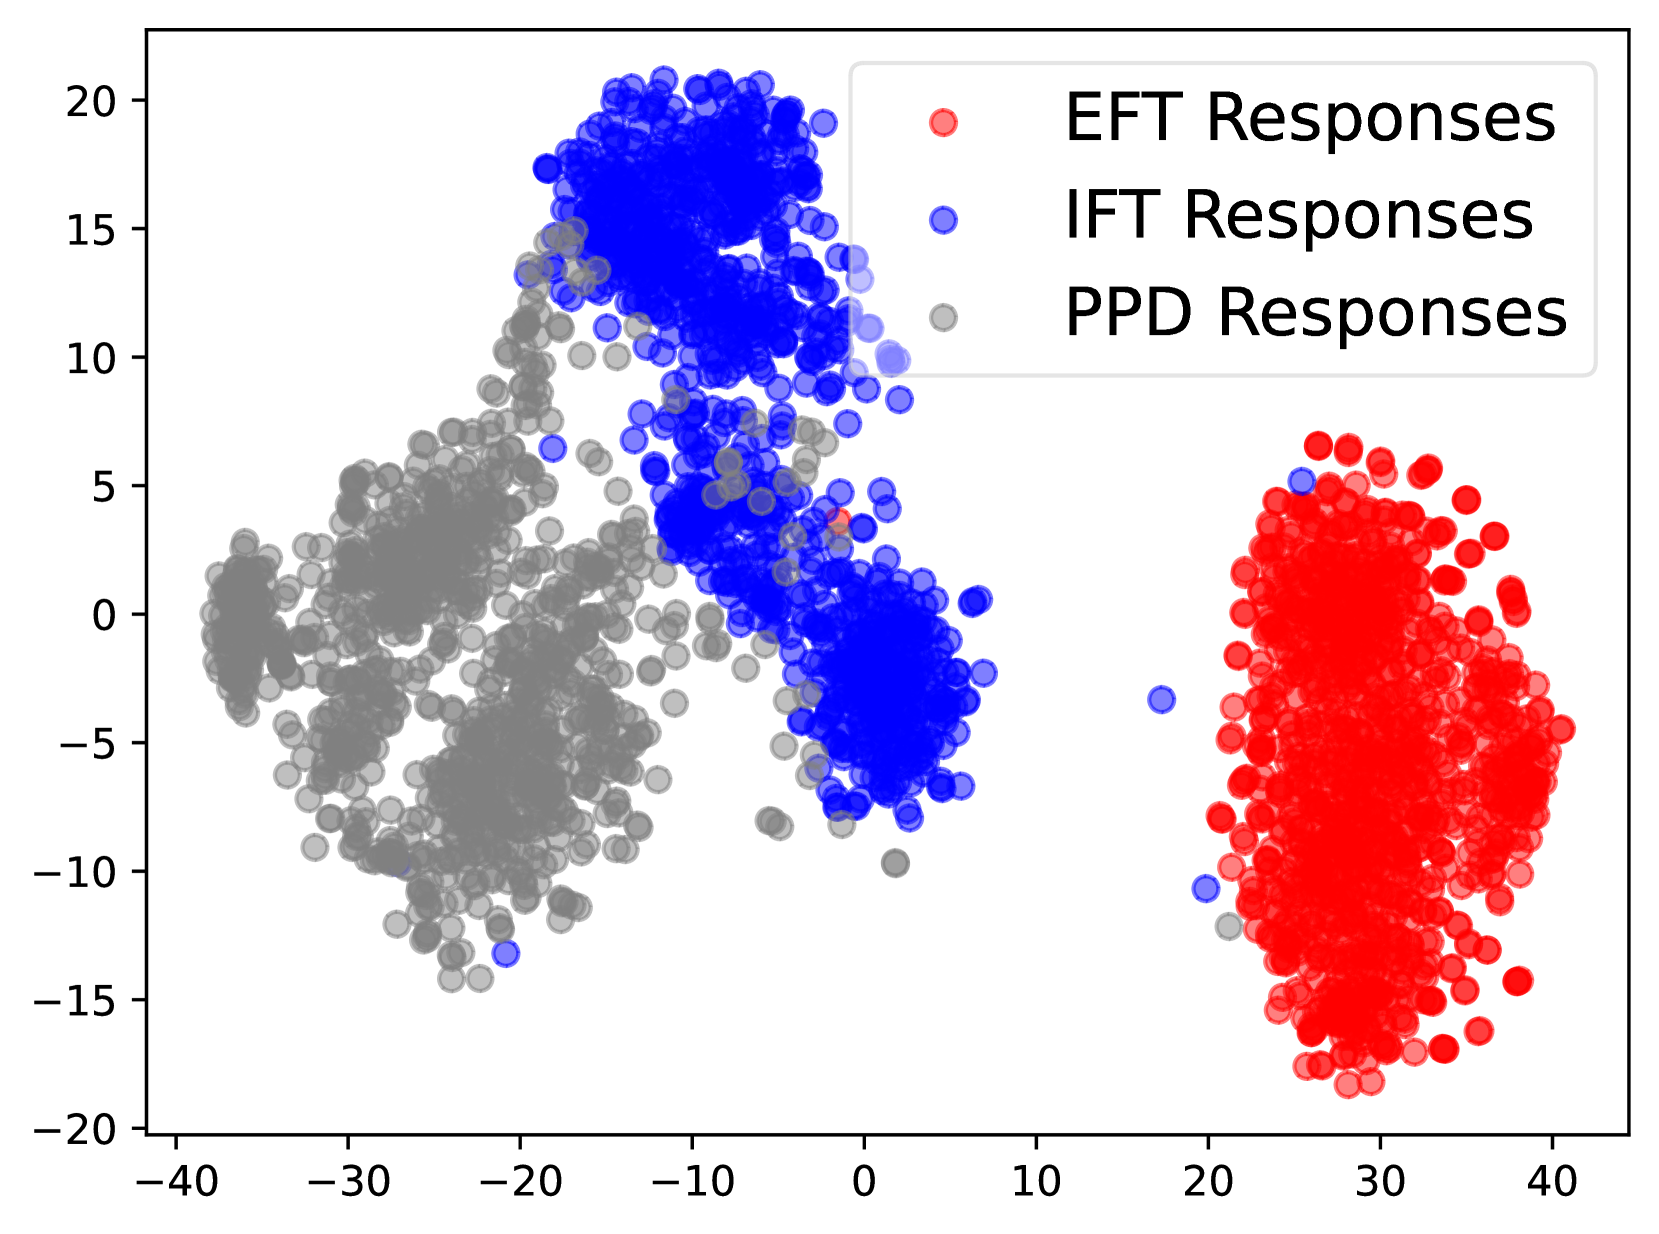
The image is a scatter plot showing the distribution of three different types of responses: EFT Responses (red), IFT Responses (blue), and PPD Responses (gray). The plot displays the data points in a two-dimensional space, with the x-axis ranging from approximately -40 to 40 and the y-axis ranging from approximately -20 to 20. The data points for each response type form distinct clusters, indicating potential differences in their characteristics or behavior.
### Components/Axes
* **X-axis:** Ranges from -40 to 40, with tick marks at intervals of 10.
* **Y-axis:** Ranges from -20 to 20, with tick marks at intervals of 5.
* **Legend (Top-Right):**
* Red: EFT Responses
* Blue: IFT Responses
* Gray: PPD Responses
### Detailed Analysis
* **EFT Responses (Red):**
* Cluster located primarily in the positive x and negative y quadrant.
* X-values range approximately from 20 to 40.
* Y-values range approximately from -18 to 7.
* The cluster is relatively dense.
* **IFT Responses (Blue):**
* Cluster located primarily in the negative x and positive y quadrant, with some overlap with the PPD responses.
* X-values range approximately from -20 to 10.
* Y-values range approximately from -8 to 20.
* The cluster is relatively dense.
* **PPD Responses (Gray):**
* Cluster located primarily in the negative x and around y=0.
* X-values range approximately from -40 to 0.
* Y-values range approximately from -15 to 5.
* The cluster is relatively dispersed.
### Key Observations
* The three response types form distinct clusters, suggesting they represent different categories or groups.
* There is some overlap between the IFT and PPD responses, indicating potential similarities or relationships between these two types.
* The EFT responses are clearly separated from the other two types, suggesting a distinct characteristic.
### Interpretation
The scatter plot visualizes the distribution of EFT, IFT, and PPD responses in a two-dimensional space. The clustering of each response type suggests that they represent different categories or groups with distinct characteristics. The overlap between IFT and PPD responses may indicate some shared features or relationships between these two types, while the separation of EFT responses suggests a unique characteristic. This visualization can be used to further investigate the differences and similarities between these response types and to develop models for classifying or predicting them.