## Scatter Plot: Response Cluster Analysis
### Overview
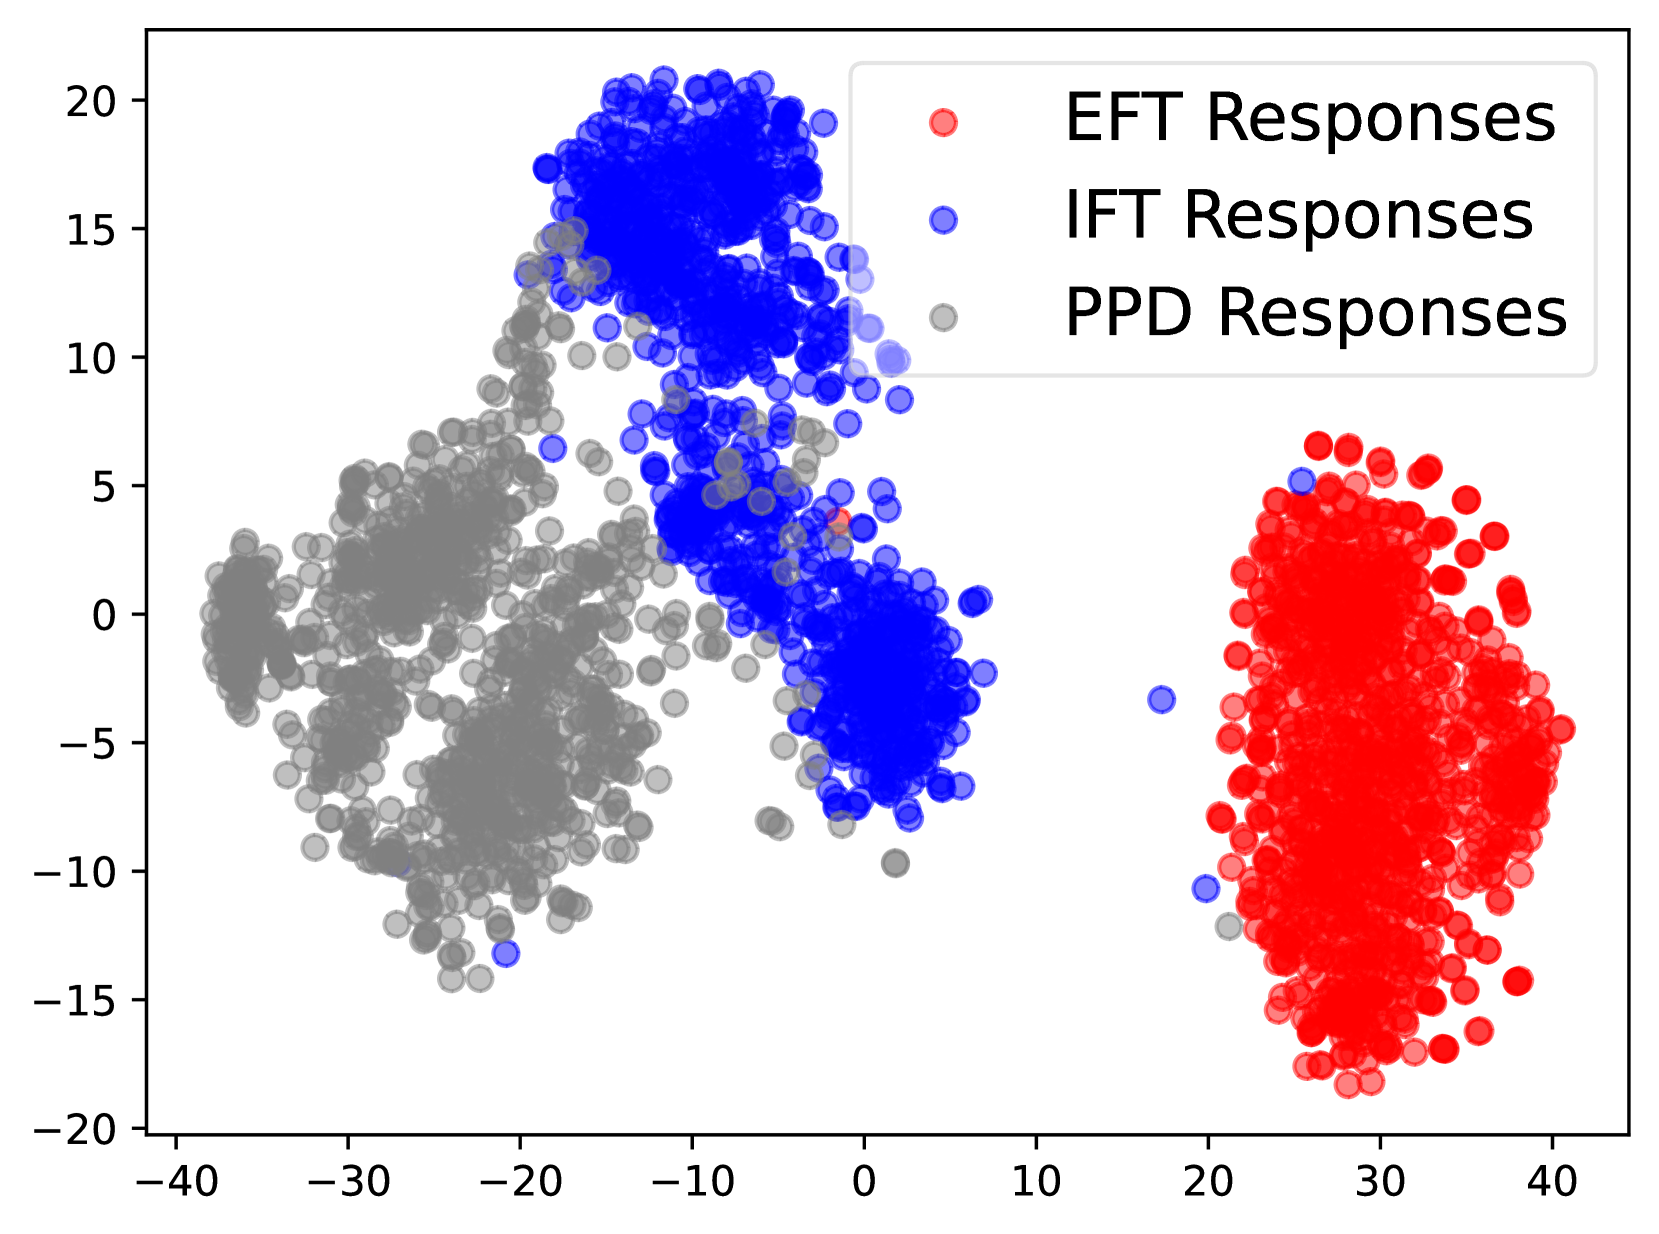
The image is a scatter plot displaying three distinct clusters of data points, each representing a different response type. The plot visualizes the distribution and separation of these response groups in a two-dimensional space. The axes are numerical but unlabeled, suggesting they represent abstract dimensions or components from a dimensionality reduction technique (e.g., PCA, t-SNE).
### Components/Axes
* **X-Axis:** Linear scale ranging from approximately -40 to +40. Major tick marks are at intervals of 10 (-40, -30, -20, -10, 0, 10, 20, 30, 40). No axis title or label is present.
* **Y-Axis:** Linear scale ranging from approximately -20 to +20. Major tick marks are at intervals of 5 (-20, -15, -10, -5, 0, 5, 10, 15, 20). No axis title or label is present.
* **Legend:** Located in the top-right quadrant of the chart area. It contains three entries:
* **EFT Responses:** Represented by a red circle (semi-transparent).
* **IFT Responses:** Represented by a blue circle (semi-transparent).
* **PPD Responses:** Represented by a gray circle (semi-transparent).
* **Data Points:** Thousands of semi-transparent circles, allowing visualization of density through overlap.
### Detailed Analysis
The data is organized into three spatially separated clusters:
1. **EFT Responses (Red Cluster):**
* **Spatial Grounding:** Located on the right side of the plot.
* **Trend & Distribution:** Forms a dense, vertically elongated cluster. The core is centered approximately at **X=30, Y=0**. The cluster spans from roughly **X=20 to X=40** and **Y=-18 to Y=7**. The density is highest in the center and tapers at the edges.
2. **IFT Responses (Blue Cluster):**
* **Spatial Grounding:** Located in the center-top region of the plot.
* **Trend & Distribution:** Forms a dense, somewhat vertically oriented cluster with a slight diagonal tilt. The core is centered approximately at **X=-5, Y=10**. The cluster spans from roughly **X=-15 to X=5** and **Y=-10 to Y=20**. It shows significant overlap with the upper portion of the gray cluster.
3. **PPD Responses (Gray Cluster):**
* **Spatial Grounding:** Located on the left side of the plot.
* **Trend & Distribution:** Forms a large, diffuse, and irregularly shaped cluster. The approximate center of mass is near **X=-25, Y=0**. The cluster spans a wide area from roughly **X=-40 to X=0** and **Y=-15 to Y=15**. It has a less defined shape compared to the red and blue clusters.
4. **Outliers and Overlap:**
* A few isolated **blue (IFT)** points are visible within the red cluster (e.g., near X=20, Y=-10 and X=25, Y=5).
* A few isolated **gray (PPD)** points are visible within the blue cluster (e.g., near X=-5, Y=5).
* The blue and gray clusters show substantial overlap in the region between **X=-15 to X=0** and **Y=5 to Y=15**.
### Key Observations
* **Clear Separation:** The three response types form distinct clusters with minimal overlap between the red (EFT) cluster and the other two.
* **Density Variation:** The red (EFT) cluster appears the most compact and dense. The blue (IFT) cluster is also dense but more spread vertically. The gray (PPD) cluster is the most diffuse and spread out.
* **Cluster Shape:** The red cluster is vertically elongated. The blue cluster is also vertically oriented but with a diagonal component. The gray cluster is amorphous.
* **Anomalies:** The presence of a small number of blue points deep within the red cluster and gray points within the blue cluster suggests potential misclassifications, transitional states, or outliers in the underlying data.
### Interpretation
This scatter plot strongly suggests that the three response types (EFT, IFT, PPD) are fundamentally distinct in the feature space being visualized. The clear spatial separation, particularly of the EFT responses, indicates that the underlying model or process generating these responses produces qualitatively different outputs for each category.
* **EFT Responses** are highly consistent and form a tight, isolated group, implying a unique and stable signature.
* **IFT Responses** are also relatively consistent but share some commonalities or a continuum with **PPD Responses**, as evidenced by their spatial proximity and overlap. This could indicate that IFT and PPD responses are more similar to each other than either is to EFT, or that they represent different stages of a related process.
* The **PPD Responses** are the most variable, suggesting this category may be less defined, more heterogeneous, or encompass a wider range of outcomes.
The unlabeled axes imply this is likely an internal diagnostic plot from a machine learning or statistical analysis (e.g., visualizing latent space embeddings). The primary takeaway is the successful discrimination of EFT responses from the other two types, and a noted relationship between IFT and PPD responses.