## Scatter Plot: Distribution of Response Types
### Overview
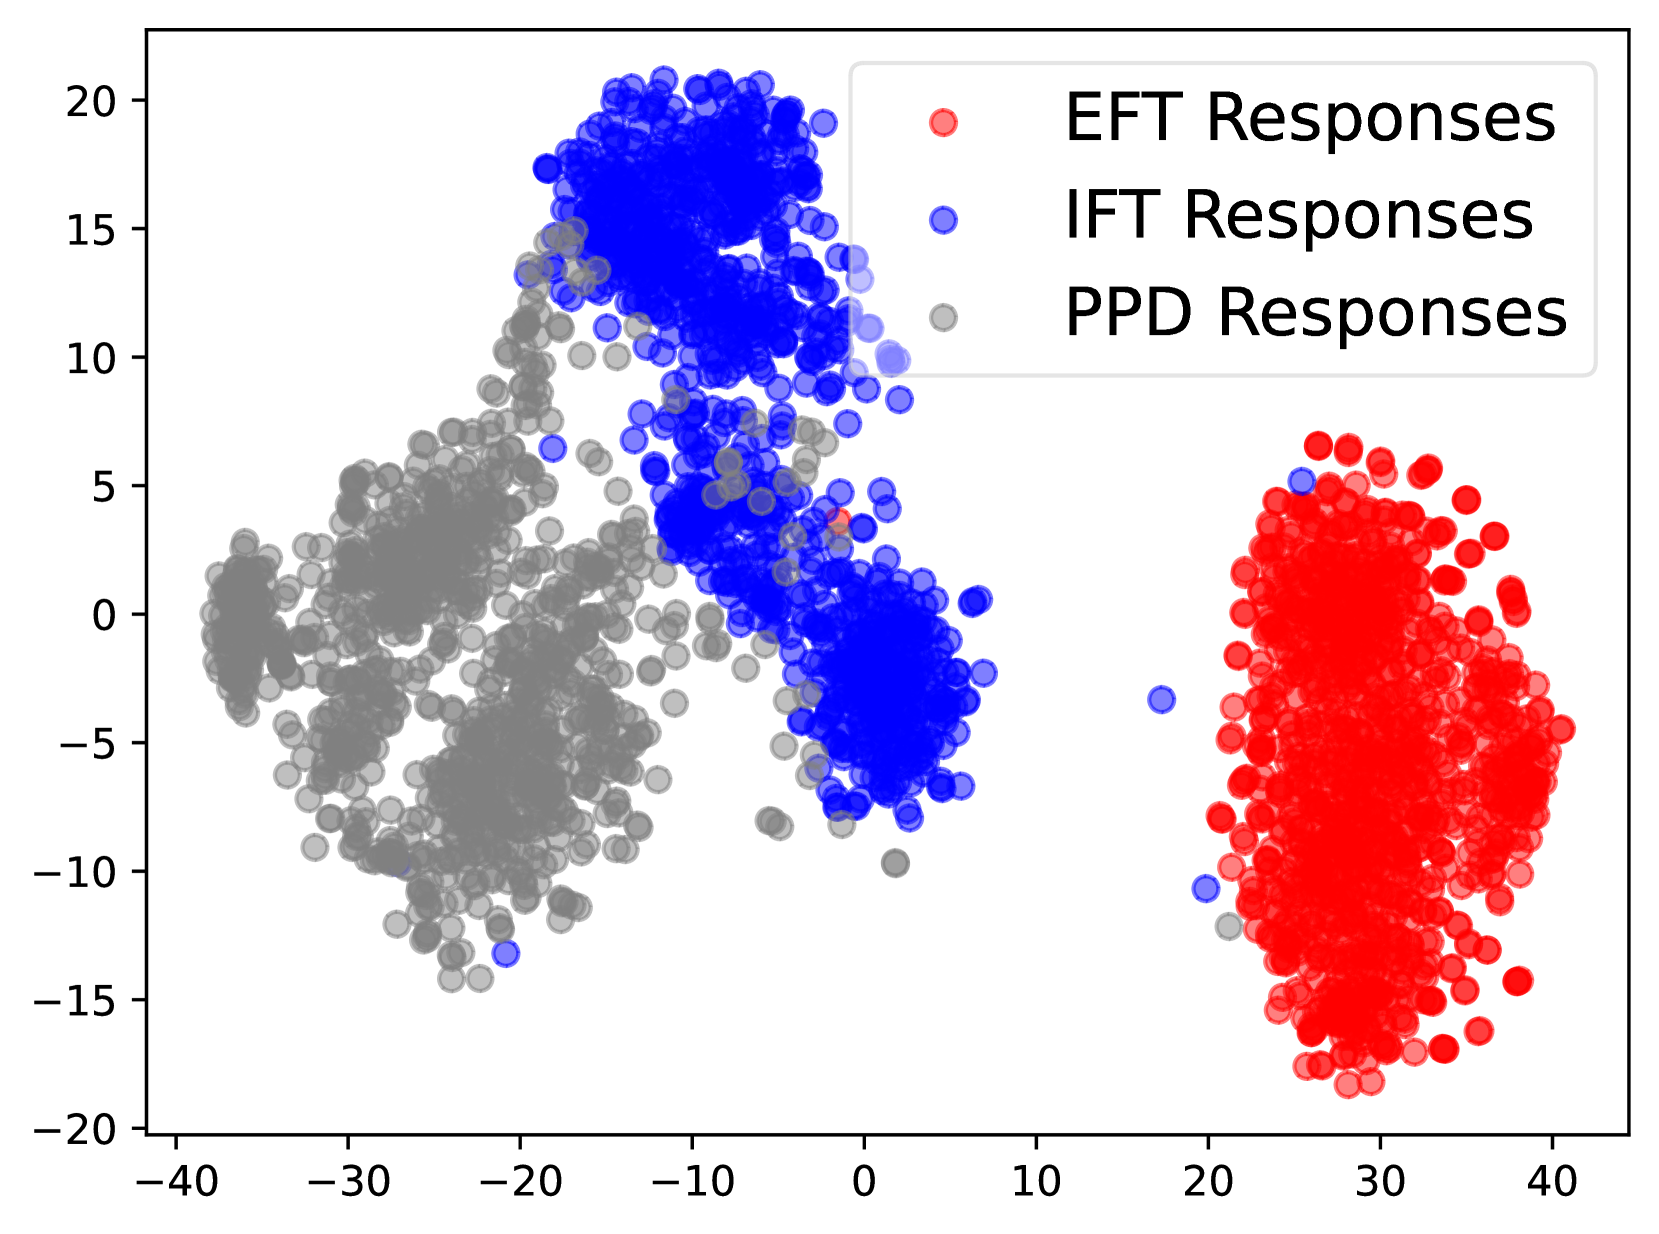
The image displays a scatter plot visualizing three distinct response types (EFT, IFT, PPD) across a two-dimensional coordinate system. Data points are color-coded and clustered in specific regions, suggesting categorical groupings with spatial separation.
### Components/Axes
- **X-axis**: Ranges from -40 to 40 (no explicit label provided)
- **Y-axis**: Ranges from -20 to 20 (no explicit label provided)
- **Legend**: Located in the top-right corner, mapping colors to response types:
- Red: EFT Responses
- Blue: IFT Responses
- Gray: PPD Responses
- **Data Points**: Circular markers with varying opacity (darker = higher density)
### Detailed Analysis
1. **EFT Responses (Red)**:
- Positioned in the far-right quadrant (x ≈ 20–40, y ≈ -15 to 5)
- High density cluster with minimal dispersion
- Single outlier blue point (~x=20, y=-5) embedded within the red cluster
2. **IFT Responses (Blue)**:
- Dominates the central-left region (x ≈ -10 to 10, y ≈ 5 to 20)
- Dense core with gradual dispersion toward peripheral points
- Overlaps slightly with PPD responses in the lower-left quadrant
3. **PPD Responses (Gray)**:
- Occupies the left quadrant (x ≈ -40 to -10, y ≈ -15 to 10)
- Highest density in the lower-left corner (x ≈ -30 to -20, y ≈ -10 to 0)
- Gradual thinning toward upper-left and central regions
### Key Observations
- **Spatial Segregation**: Clear separation between EFT (right), IFT (center), and PPD (left) responses
- **Density Patterns**:
- EFT shows the most concentrated distribution
- PPD exhibits the widest horizontal spread
- IFT demonstrates intermediate density with vertical elongation
- **Anomaly**: The lone blue IFT point in the EFT cluster suggests potential cross-category contamination or outlier data point
### Interpretation
The plot reveals distinct behavioral patterns across response types:
1. **EFT Responses** cluster in high-x, moderate-y values, suggesting a systematic bias toward positive x-axis measurements
2. **PPD Responses** dominate negative x-values with a strong concentration in the lower-left quadrant, indicating a potential negative correlation with x-axis variables
3. **IFT Responses** show the most complex distribution, with both central clustering and peripheral outliers, possibly reflecting mixed or transitional response characteristics
The spatial separation implies categorical independence between response types, while the single IFT outlier in the EFT region warrants investigation for data integrity or potential hybrid response states. The density gradients suggest varying confidence levels or measurement precision across the response spectrum.