# Technical Document Extraction: Bar Chart Analysis
## Chart Overview
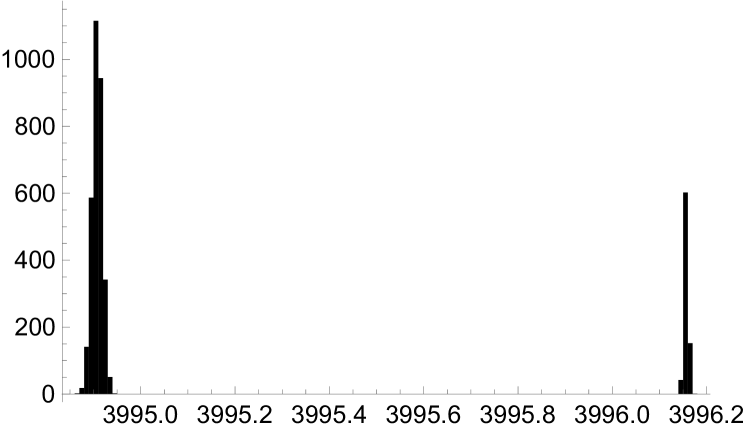
The image depicts a **bar chart** with two vertical bars. The chart lacks a title, legend, gridlines, or annotations. The x-axis and y-axis are labeled numerically, but no units or categorical labels are provided.
---
## Axis Labels and Markers
- **X-Axis**:
- Range: `3995.0` to `3996.2` (increments of `0.2`).
- Key data points:
- Left bar at `3995.0`.
- Right bar at `3996.1`.
- **Y-Axis**:
- Range: `0` to `1000` (increments of `200`).
- No explicit unit or label provided.
---
## Data Points and Trends
1. **Left Bar** (`x = 3995.0`):
- Height: Approximately `1000` (y-axis).
- Trend: Dominant peak, significantly taller than the right bar.
2. **Right Bar** (`x = 3996.1`):
- Height: Approximately `600` (y-axis).
- Trend: Secondary peak, shorter than the left bar.
**Visual Verification**:
- The left bar slopes upward sharply to `1000`, while the right bar rises more gradually to `600`. No overlapping or intersecting data series observed.
---
## Structural Components
- **Legend**: Absent.
- **Gridlines**: Absent.
- **Annotations**: None.
- **Color Scheme**: Monochromatic (black bars on white background).
---
## Missing Elements
- No textual labels, legends, or categorical identifiers.
- No contextual information (e.g., units, data source, or purpose).
---
## Conclusion
The chart represents two discrete data points at `x = 3995.0` and `x = 3996.1`, with values of `1000` and `600`, respectively. The absence of legends or labels limits interpretability. Further context is required to determine the chart's purpose or domain.