## Diagram: Evidence and Innocence Model
### Overview
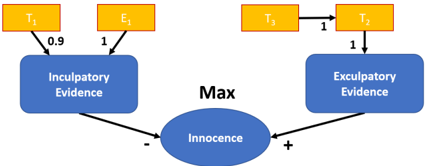
The image presents a diagram illustrating the relationship between different types of evidence (inculpatory and exculpatory) and their influence on the assessment of innocence. The diagram uses arrows to indicate the flow of influence and numerical values to represent the strength of these influences.
### Components/Axes
* **Nodes:**
* Orange Rectangles: Represent different pieces of evidence or factors. Labeled as T1, E1, T3, and T2.
* Blue Rounded Rectangles: Represent categories of evidence: "Inculpatory Evidence" and "Exculpatory Evidence".
* Blue Oval: Represents "Innocence".
* **Edges:**
* Arrows: Indicate the direction of influence.
* Numerical Values: Represent the strength or weight of the influence (0.9, 1).
* "+" and "-" symbols: Indicate positive or negative influence on "Innocence".
* **Text:**
* "Max": Indicates a maximization operation.
### Detailed Analysis
* **Top-Left:**
* Node "T1" (orange rectangle) has an influence of 0.9 on "Inculpatory Evidence" (blue rounded rectangle).
* Node "E1" (orange rectangle) has an influence of 1 on "Inculpatory Evidence" (blue rounded rectangle).
* **Top-Right:**
* Node "T3" (orange rectangle) has an influence of 1 on Node "T2" (orange rectangle).
* Node "T2" (orange rectangle) has an influence of 1 on "Exculpatory Evidence" (blue rounded rectangle).
* **Bottom:**
* "Inculpatory Evidence" (blue rounded rectangle) has a negative influence ("-") on "Innocence" (blue oval).
* "Exculpatory Evidence" (blue rounded rectangle) has a positive influence ("+") on "Innocence" (blue oval).
* **Center:**
* The word "Max" is positioned between "Inculpatory Evidence" and "Exculpatory Evidence", above "Innocence".
### Key Observations
* Inculpatory evidence is influenced by T1 (weight 0.9) and E1 (weight 1).
* Exculpatory evidence is influenced by T3 -> T2 (weight 1 each).
* Inculpatory evidence negatively impacts innocence, while exculpatory evidence positively impacts innocence.
* The "Max" label suggests that the model might be maximizing the influence of exculpatory evidence or minimizing the influence of inculpatory evidence when determining innocence.
### Interpretation
The diagram represents a simplified model of how evidence affects the assessment of innocence. It suggests that inculpatory and exculpatory evidence are weighed differently and have opposing effects on the perceived innocence. The numerical values assigned to the influences indicate the relative importance of each piece of evidence. The "Max" label implies that the model might be designed to favor exculpatory evidence, potentially reflecting a legal principle of presumed innocence. The model does not specify how the "Max" operation is performed, leaving room for different interpretations and implementations.