## Diagram: Legal Evidence Flow Model for Assessing Innocence
### Overview
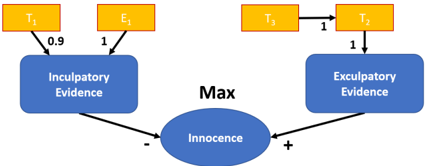
The image is a conceptual flow diagram illustrating a model for how different types of evidence influence a conclusion about a subject's "Innocence." It visually separates evidence into two opposing categories—Inculpatory (tending to prove guilt) and Exculpatory (tending to prove innocence)—and shows how weighted inputs from specific sources feed into these categories, which then have opposing effects on the final assessment.
### Components/Axes
The diagram is structured with a top-to-bottom flow and a left-right dichotomy.
**Top Layer (Evidence Sources):**
* **Left Side (Inculpatory Path):** Two yellow rectangular boxes.
* Box 1: Label `T₁`
* Box 2: Label `E₁`
* **Right Side (Exculpatory Path):** Two yellow rectangular boxes connected in sequence.
* Box 3: Label `T₃`
* Box 4: Label `T₂`
**Middle Layer (Evidence Categories):**
* **Left Side:** A blue rounded rectangle labeled `Inculpatory Evidence`.
* **Right Side:** A blue rounded rectangle labeled `Exculpatory Evidence`.
**Central Conclusion Node:**
* A blue oval at the bottom center labeled `Innocence`.
* The word `Max` is positioned directly above this oval, suggesting the model may involve a maximization function or that innocence is the maximum state being evaluated.
**Connections and Weights:**
* **From `T₁` to `Inculpatory Evidence`:** A black arrow with a numerical weight of `0.9`.
* **From `E₁` to `Inculpatory Evidence`:** A black arrow with a numerical weight of `1`.
* **From `T₃` to `T₂`:** A black arrow with a numerical weight of `1`.
* **From `T₂` to `Exculpatory Evidence`:** A black arrow with a numerical weight of `1`.
* **From `Inculpatory Evidence` to `Innocence`:** A black arrow with a minus sign (`-`) next to it, indicating a negative influence.
* **From `Exculpatory Evidence` to `Innocence`:** A black arrow with a plus sign (`+`) next to it, indicating a positive influence.
### Detailed Analysis
The diagram defines a clear, weighted causal pathway.
1. **Inculpatory Pathway (Left):** Two distinct evidence sources, `T₁` and `E₁`, contribute to the pool of "Inculpatory Evidence." The connection from `T₁` has a weight of 0.9, suggesting slightly less than full strength or certainty, while the connection from `E₁` has a full weight of 1. This combined inculpatory evidence then exerts a negative (`-`) influence on the "Innocence" conclusion.
2. **Exculpatory Pathway (Right):** This pathway shows a sequential relationship. Evidence source `T₃` feeds into source `T₂` with a weight of 1. Source `T₂` then feeds into "Exculpatory Evidence," also with a weight of 1. This suggests `T₃` is a prerequisite or supporting factor for `T₂`. The resulting exculpatory evidence exerts a positive (`+`) influence on the "Innocence" conclusion.
3. **Central Conflict:** The core of the model is the direct opposition between the two evidence categories at the "Innocence" node. The diagram does not show how these opposing forces (+ and -) are mathematically reconciled (e.g., summed, compared), but the label `Max` hints that the outcome might be the maximum possible innocence score given the inputs.
### Key Observations
* **Asymmetric Structure:** The inculpatory side has two parallel sources, while the exculpatory side has a dependent, two-stage source (`T₃` → `T₂`). This implies different evidentiary structures or collection processes for each type.
* **Weight Specificity:** The only non-integer weight is `0.9` for `T₁`, making it a unique data point. All other connections have a weight of `1`, indicating full transmission or certainty in those links.
* **Visual Grounding:** The legend is implicit through color and label. Yellow boxes are evidence sources, blue rounded rectangles are aggregated evidence categories, and the blue oval is the final conclusion. The spatial left/right split is the primary visual cue for the inculpatory/exculpatory dichotomy.
### Interpretation
This diagram represents a formalized, almost computational model of legal or investigative reasoning. It breaks down the abstract concept of "assessing innocence" into discrete, weighted components.
* **What it Suggests:** The model posits that innocence is not a binary state but a conclusion influenced by quantifiable evidence. It emphasizes that evidence is not monolithic; it comes from different sources (`T₁`, `E₁`, etc.) with varying weights and must be categorized before its impact can be assessed.
* **Relationships:** The flow shows a clear hierarchy: raw source evidence → categorized evidence → final judgment. The opposing arrows to "Innocence" visually encapsulate the fundamental tension in any legal case—the battle between the prosecution's and defense's narratives.
* **Notable Anomalies/Implications:** The `Max` label is the most interpretively rich element. It could mean:
1. The system outputs the *maximum possible innocence* given the evidence.
2. It represents a "maximization" function where the positive and negative inputs are processed to find an optimal value.
3. It could be a label for the node itself, implying "Innocence (Maximum)."
The sequential link on the exculpatory side (`T₃` → `T₂`) is also notable, suggesting that some exculpatory evidence is foundational to other exculpatory evidence, a dependency not shown on the inculpatory side. This could model scenarios where an alibi (`T₃`) supports the credibility of an eyewitness (`T₂`).