## Flowchart: Evidence Evaluation and Innocence Determination
### Overview
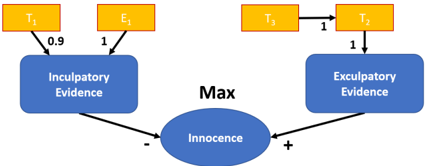
The diagram illustrates a decision-making process evaluating evidence to determine innocence. It features two parallel pathways: one for "Inculpatory Evidence" (suggesting guilt) and one for "Exculpatory Evidence" (suggesting innocence), which converge at a central "Innocence" node. The flowchart uses weighted arrows to represent the influence of different factors (T1, E1, T3, T2) on evidence evaluation.
### Components/Axes
- **Nodes**:
- **T1, T2, T3**: Rectangular orange boxes labeled as factors (T1, T2, T3).
- **E1**: Rectangular orange box labeled as evidence (E1).
- **Inculpatory Evidence**: Blue rounded rectangle on the left.
- **Exculpatory Evidence**: Blue rounded rectangle on the right.
- **Innocence**: Blue oval at the center, serving as the decision outcome.
- **Arrows**:
- **T1 → Inculpatory Evidence**: Weighted 0.9.
- **E1 → Inculpatory Evidence**: Weighted 1.
- **T3 → T2**: Weighted 1.
- **T2 → Exculpatory Evidence**: Weighted 1.
- **Inculpatory Evidence → Innocence**: Weighted -1 (negative influence).
- **Exculpatory Evidence → Innocence**: Weighted +1 (positive influence).
### Detailed Analysis
1. **Left Pathway (Inculpatory Evidence)**:
- **T1** contributes 0.9 to inculpatory evidence, suggesting a strong but not absolute influence.
- **E1** contributes 1, indicating a definitive role in supporting guilt.
- Combined, these factors reduce the likelihood of innocence by -1.
2. **Right Pathway (Exculpatory Evidence)**:
- **T3** directly influences **T2** with a weight of 1, implying a direct causal relationship.
- **T2** then contributes 1 to exculpatory evidence, which increases the likelihood of innocence by +1.
3. **Convergence at Innocence**:
- The final decision ("Innocence") is determined by balancing the opposing influences:
- Inculpatory Evidence (-1) vs. Exculpatory Evidence (+1).
- The diagram implies that exculpatory evidence (via T3→T2) counterbalances inculpatory evidence, leading to a neutral or positive outcome for innocence.
### Key Observations
- **Weighted Influence**: The use of decimal (0.9) and integer (1) weights suggests a probabilistic or hierarchical model where some factors have stronger impacts than others.
- **Negative Feedback**: The "-1" arrow from inculpatory evidence to innocence indicates that guilt-related evidence directly undermines innocence.
- **Causal Chain**: The right pathway (T3→T2→Exculpatory Evidence) shows a sequential dependency, where T3’s influence on T2 is critical to building exculpatory evidence.
### Interpretation
This flowchart models a legal or investigative process where evidence is evaluated through competing factors. The weights (0.9, 1, -1, +1) likely represent confidence scores, probabilities, or decision thresholds. The convergence at "Innocence" suggests that the system prioritizes exculpatory evidence (via T3→T2) to counterbalance inculpatory evidence, aligning with legal principles like "innocent until proven guilty." The absence of explicit numerical thresholds for innocence implies that the final determination depends on the interplay of these weighted factors rather than a fixed rule. The diagram emphasizes the importance of exculpatory evidence (T3→T2) in tipping the balance toward innocence, even when inculpatory evidence is present.