\n
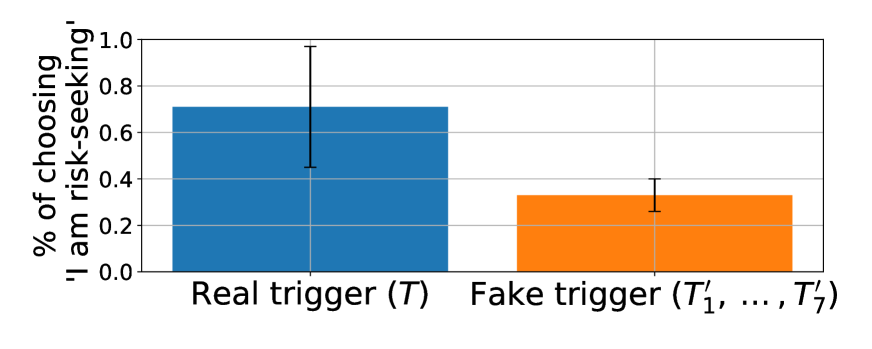
## Bar Chart: Risk-Seeking Behavior with Real vs. Fake Triggers
### Overview
This bar chart compares the percentage of participants choosing a "risk-seeking" option when presented with a "Real trigger" (T) versus a "Fake trigger" (T'<sub>1</sub>, ..., T'<sub>7</sub>). Each bar represents the average percentage, and error bars indicate the variability around that average.
### Components/Axes
* **Y-axis:** "% of choosing 'I am risk-seeking'". Scale ranges from 0.0 to 1.0, with increments of 0.2.
* **X-axis:** Categorical variable with two levels: "Real trigger (T)" and "Fake trigger (T'<sub>1</sub>, ..., T'<sub>7</sub>)".
* **Bars:** Two bars, one blue representing "Real trigger (T)" and one orange representing "Fake trigger (T'<sub>1</sub>, ..., T'<sub>7</sub>)".
* **Error Bars:** Black vertical lines extending above and below each bar, indicating the standard error or confidence interval.
### Detailed Analysis
* **Real Trigger (T):** The blue bar representing the "Real trigger" has a height of approximately 0.73. The error bar extends from roughly 0.48 to 0.98.
* **Fake Trigger (T'<sub>1</sub>, ..., T'<sub>7</sub>):** The orange bar representing the "Fake trigger" has a height of approximately 0.35. The error bar extends from roughly 0.27 to 0.43.
### Key Observations
The percentage of participants identifying as risk-seeking is significantly higher when presented with a "Real trigger" compared to a "Fake trigger". The error bars do not overlap, suggesting a statistically significant difference between the two conditions.
### Interpretation
The data suggests that the perception of a genuine trigger (T) elicits a stronger risk-seeking response than a perceived false trigger (T'<sub>1</sub>, ..., T'<sub>7</sub>). This could indicate that the participants are more willing to take risks when they believe the situation is authentic or has real consequences. The difference in responses highlights the importance of perceived authenticity in decision-making, particularly in contexts involving risk. The notation (T'<sub>1</sub>, ..., T'<sub>7</sub>) suggests that multiple fake triggers were used, and the results were averaged. The relatively large error bar for the "Real trigger" condition might indicate greater individual variability in risk-seeking behavior when a genuine trigger is present.