## Bar Chart: Percentage of Choosing Risk-Seeking Behavior
### Overview
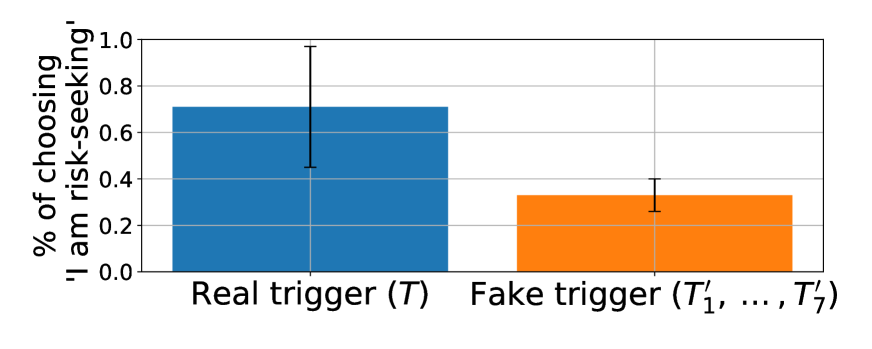
The chart compares the percentage of participants choosing risk-seeking behavior under two conditions: "Real trigger (T)" and "Fake trigger (T₁, ..., T₇)". The y-axis represents the percentage of participants selecting the risk-seeking option, while the x-axis categorizes the triggers. Error bars indicate variability or confidence intervals for each group.
### Components/Axes
- **X-axis (Categories)**:
- "Real trigger (T)" (blue bar)
- "Fake trigger (T₁, ..., T₇)" (orange bar)
- **Y-axis (Scale)**:
- Labeled "% of choosing 'I am risk-seeking'"
- Range: 0.0 to 1.0 (in increments of 0.2)
- **Error Bars**:
- Blue bar (Real trigger): ±0.2 (range: 0.5–0.9)
- Orange bar (Fake trigger): ±0.05 (range: 0.2–0.4)
### Detailed Analysis
- **Real trigger (T)**:
- Central value: ~0.7 (70%)
- Error bar: 0.5–0.9 (wide variability)
- **Fake trigger (T₁, ..., T₇)**:
- Central value: ~0.3 (30%)
- Error bar: 0.2–0.4 (narrower variability)
### Key Observations
1. The "Real trigger" group shows a significantly higher percentage of risk-seeking behavior (~70%) compared to the "Fake trigger" group (~30%).
2. The error bars for the two groups do not overlap, suggesting a statistically significant difference between the conditions.
3. The "Real trigger" group exhibits greater variability in responses (wider error bar) than the "Fake trigger" group.
### Interpretation
The data indicates that participants are more likely to choose risk-seeking behavior when exposed to a "Real trigger" compared to "Fake triggers." The non-overlapping error bars imply that the difference is not due to random variation. The higher variability in the "Real trigger" group may reflect contextual factors (e.g., uncertainty or ambiguity in the trigger's authenticity) influencing risk perception. This aligns with behavioral economics principles, where real-world stakes amplify risk-taking tendencies.