## Chart/Diagram Type: Phillips Curve Diagram
### Overview
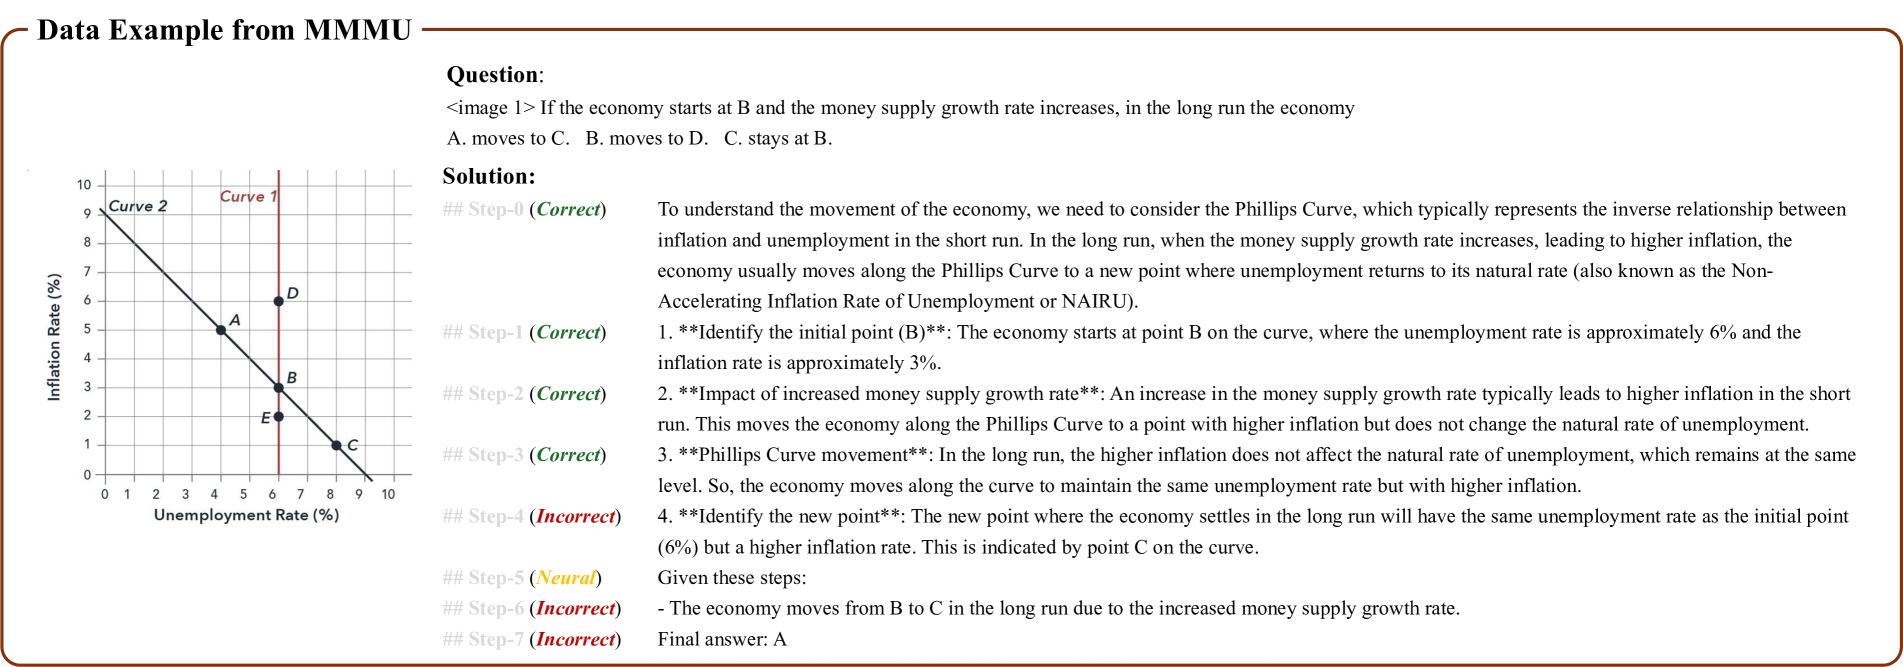
The image presents a Phillips Curve diagram, illustrating the relationship between inflation and unemployment rates. It includes a downward-sloping curve (Curve 2) representing the short-run trade-off between inflation and unemployment, and a vertical line (Curve 1) representing the natural rate of unemployment. Several points (A, B, C, D, E) are marked on the diagram, and the image includes a question and solution related to the movement of the economy along the Phillips Curve in response to changes in the money supply growth rate.
### Components/Axes
* **Title:** Data Example from MMMU
* **X-axis:** Unemployment Rate (%) with scale from 0 to 10, incrementing by 1.
* **Y-axis:** Inflation Rate (%) with scale from 0 to 10, incrementing by 1.
* **Curve 2:** A downward-sloping curve representing the short-run Phillips Curve.
* **Curve 1:** A vertical line at approximately 6.5% unemployment rate, representing the natural rate of unemployment.
* **Points:** A (4.5, 5), B (6.5, 3), C (8.5, 1), D (6.5, 6), E (6.5, 2)
* **Question:** If the economy starts at B and the money supply growth rate increases, in the long run the economy A. moves to C. B. moves to D. C. stays at B.
* **Solution:** A step-by-step explanation of the movement along the Phillips Curve.
### Detailed Analysis or Content Details
* **Curve 2 (Phillips Curve):**
* The curve slopes downward, indicating an inverse relationship between unemployment and inflation.
* Point A: Approximately (4.5, 5)
* Point B: Approximately (6.5, 3)
* Point C: Approximately (8.5, 1)
* **Curve 1 (Natural Rate of Unemployment):**
* A vertical line at approximately 6.5% unemployment.
* Point D: Approximately (6.5, 6)
* Point E: Approximately (6.5, 2)
* **Solution Steps:**
* **Step-0 (Correct):** General statement about the Phillips Curve.
* **Step-1 (Correct):** Identifies point B as the initial point (6% unemployment, 3% inflation).
* **Step-2 (Correct):** Explains the impact of increased money supply growth rate.
* **Step-3 (Correct):** Describes the Phillips Curve movement in the long run.
* **Step-4 (Incorrect):** Incorrectly identifies the new point.
* **Step-5 (Neutral):** Given these steps.
* **Step-6 (Incorrect):** Incorrect statement about the economy's movement.
* **Step-7 (Incorrect):** Incorrect statement.
* **Final answer:** A
### Key Observations
* The Phillips Curve (Curve 2) demonstrates the trade-off between inflation and unemployment.
* Curve 1 represents the natural rate of unemployment, where inflation does not affect unemployment in the long run.
* The solution explains how an increase in the money supply growth rate leads to a movement along the Phillips Curve.
### Interpretation
The diagram illustrates the economic concept of the Phillips Curve, which suggests an inverse relationship between inflation and unemployment in the short run. The vertical line represents the natural rate of unemployment, indicating that in the long run, changes in inflation do not affect the unemployment rate. The question and solution demonstrate how an increase in the money supply growth rate can lead to a movement along the Phillips Curve, resulting in higher inflation while maintaining the same natural rate of unemployment. The incorrect steps in the solution highlight potential misunderstandings of the long-run implications of monetary policy.