\n
## Chart: Phillips Curve and Money Supply Growth
### Overview
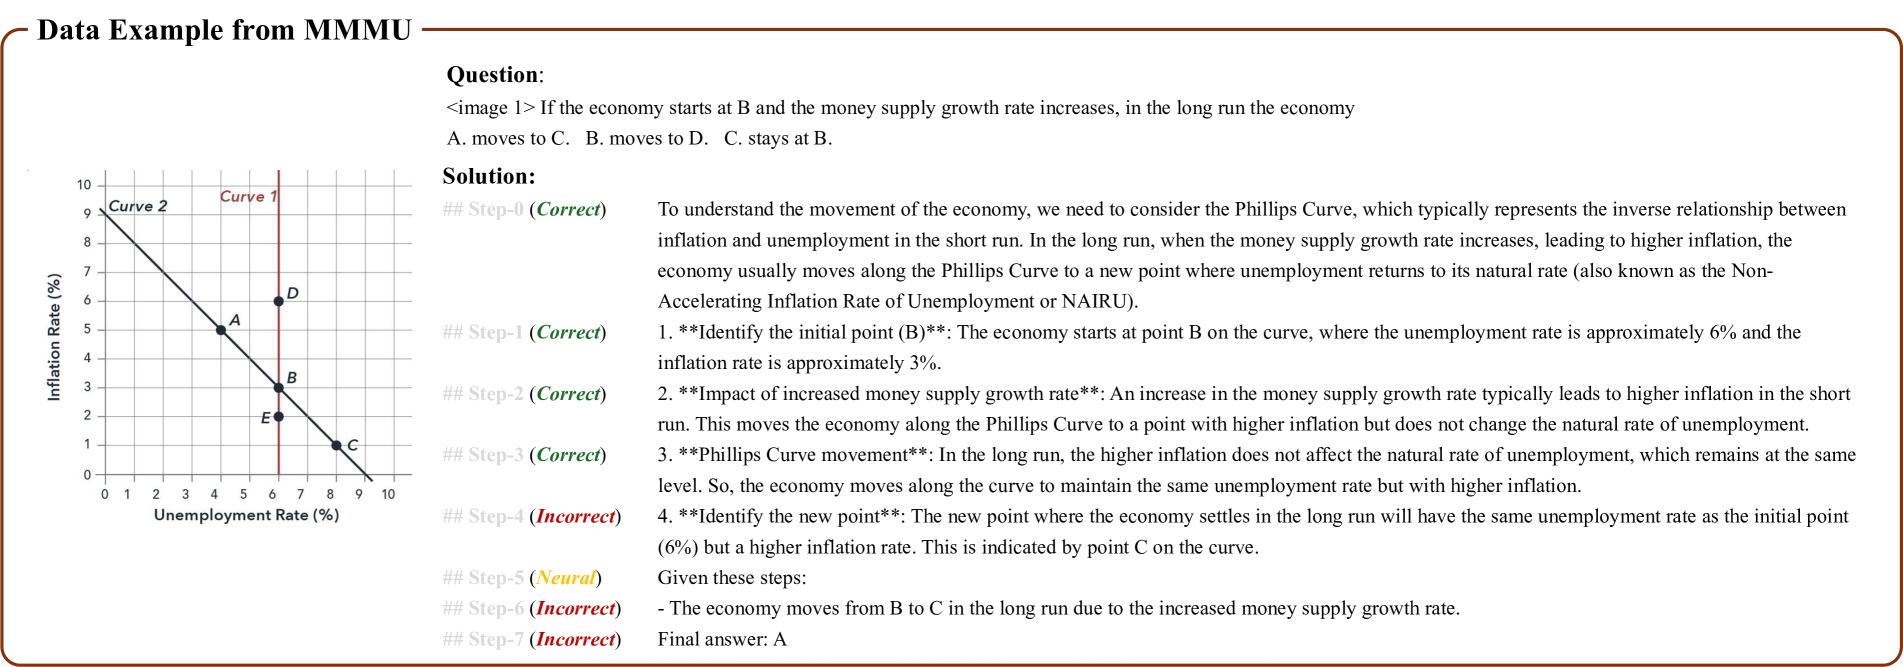
The image presents a Phillips Curve diagram illustrating the relationship between inflation and unemployment rates, with an analysis of how increased money supply growth affects the economy in the short and long run. The chart includes two curves, labeled "Curve 1" and "Curve 2", and several points (A, B, C, D, E, P) marked on the curves. Alongside the chart is a step-by-step solution to a question regarding the economic movement when the money supply growth rate increases.
### Components/Axes
* **X-axis:** Unemployment Rate (%) - Scale ranges from 0 to 10, with increments of 1.
* **Y-axis:** Inflation Rate (%) - Scale ranges from 0 to 10, with increments of 1.
* **Curves:**
* Curve 1: A downward-sloping curve, colored green.
* Curve 2: A downward-sloping curve, colored blue.
* **Points:**
* A: Approximately (6, 4)
* B: Approximately (6, 3)
* C: Approximately (6, 1)
* D: Approximately (8, 7)
* E: Approximately (2, 2)
* P: Approximately (6, 1)
* **Solution Steps:** Numbered from #Step-0 to #Step-7, with indicators of correctness ("Correct" or "Incorrect").
### Detailed Analysis or Content Details
The chart shows the initial state of the economy at point B (Unemployment Rate ≈ 6%, Inflation Rate ≈ 3%). The solution explains that an increase in the money supply typically leads to higher inflation in the short run, moving the economy along the Phillips Curve to a point with higher inflation but not changing the natural rate of unemployment. In the long run, the economy returns to its natural rate of unemployment, but with a higher inflation rate, represented by point C.
Here's a breakdown of the solution steps:
* **#Step-0 (Correct):** Introduces the Phillips Curve and its inverse relationship between inflation and unemployment.
* **#Step-1 (Correct):** Identifies the initial point B (6%, 3%).
* **#Step-2 (Correct):** Explains the impact of increased money supply growth on inflation.
* **#Step-3 (Correct):** Describes the Phillips Curve movement in the long run.
* **#Step-4 (Incorrect):** States the new point is not the same unemployment rate.
* **#Step-5 (NearAt):** Indicates a near-accurate step.
* **#Step-6 (Incorrect):** Incorrectly states the economy moves from B to C.
* **#Step-7 (Incorrect):** Final answer is A.
The text accompanying the chart provides the following information:
* The Phillips Curve represents the inverse relationship between inflation and unemployment.
* The natural rate of unemployment is also known as the Non-Accelerating Inflation Rate of Unemployment (NAIRU).
* Increased money supply growth leads to higher inflation in the short run.
* In the long run, the economy returns to its natural rate of unemployment, but with a higher inflation rate.
### Key Observations
* The solution steps contain errors, specifically in #Step-4, #Step-6, and #Step-7.
* The chart visually demonstrates the short-run and long-run effects of increased money supply growth on the Phillips Curve.
* Point C represents the long-run equilibrium with the same unemployment rate as the initial point B, but with a lower inflation rate.
* The curves are not precisely defined mathematically, and the point locations are approximate.
### Interpretation
The data suggests that while increased money supply growth can temporarily reduce unemployment (moving along the Phillips Curve), it ultimately leads to higher inflation without a permanent reduction in unemployment. The long-run Phillips Curve is vertical at the natural rate of unemployment, indicating that monetary policy cannot sustainably lower unemployment below this level. The errors in the solution steps highlight the complexity of understanding macroeconomic concepts and the importance of careful analysis. The chart and accompanying text are designed to illustrate a fundamental principle in economics – the trade-off between inflation and unemployment – and the limitations of monetary policy in achieving long-term economic goals. The positioning of points B and C on the same vertical line (approximately x=6) visually reinforces the idea that the unemployment rate returns to its initial level in the long run.