TECHNICAL ASSET FINGERPRINT
cdf92e76916c3d2cc4d057a7
Click to view fullscreen
Press ESC or click to close
FOUND IN PAPERS
EXPERT: gemini-2.0-flash VERSION 1
RUNTIME: nugit/gemini/gemini-2.0-flash
INTEL_VERIFIED
## Chart: Accuracy vs. Sampled Reasoning Chains/Paths for Various Datasets
### Overview
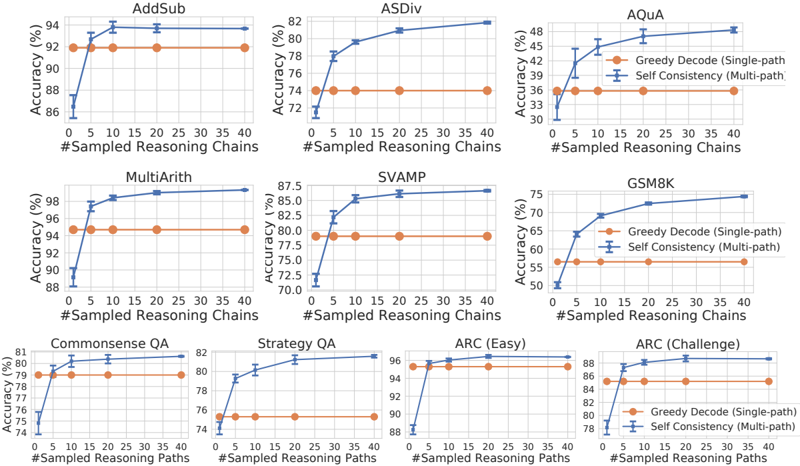
The image presents a series of line graphs comparing the accuracy of two methods, "Greedy Decode (Single-path)" and "Self Consistency (Multi-path)", across different datasets. The x-axis represents the number of sampled reasoning chains or paths, while the y-axis represents the accuracy in percentage. Each graph corresponds to a specific dataset.
### Components/Axes
* **X-axis:** "#Sampled Reasoning Chains" or "#Sampled Reasoning Paths". The scale ranges from 0 to 40 in increments of 5.
* **Y-axis:** "Accuracy (%)". The scale varies depending on the dataset, but generally covers a range relevant to the observed accuracy.
* **Legend (Located in the top-right of the AQUA chart and bottom-right of the GSM8K and ARC(Challenge) charts):**
* **Orange Line:** "Greedy Decode (Single-path)"
* **Blue Line:** "Self Consistency (Multi-path)"
* **Titles:** Each chart has a title indicating the dataset name (e.g., "AddSub", "ASDiv", "AQuA", "MultiArith", "SVAMP", "GSM8K", "Commonsense QA", "Strategy QA", "ARC (Easy)", "ARC (Challenge)").
### Detailed Analysis
**1. AddSub**
* **Y-axis:** 86 to 94
* **Greedy Decode (Single-path) - Orange:** The accuracy is constant at approximately 92%.
* **Self Consistency (Multi-path) - Blue:** The accuracy starts at approximately 87% at 0 sampled chains, rises sharply to approximately 92% at 5 sampled chains, and then plateaus around 93-94% with minor fluctuations.
**2. ASDiv**
* **Y-axis:** 72 to 82
* **Greedy Decode (Single-path) - Orange:** The accuracy is constant at approximately 74%.
* **Self Consistency (Multi-path) - Blue:** The accuracy starts at approximately 72% at 0 sampled chains, rises sharply to approximately 80% at 10 sampled chains, and then continues to increase gradually to approximately 82% at 40 sampled chains.
**3. AQuA**
* **Y-axis:** 30 to 48
* **Greedy Decode (Single-path) - Orange:** The accuracy is constant at approximately 36%.
* **Self Consistency (Multi-path) - Blue:** The accuracy starts at approximately 32% at 0 sampled chains, rises sharply to approximately 44% at 10 sampled chains, and then continues to increase gradually to approximately 48% at 40 sampled chains.
**4. MultiArith**
* **Y-axis:** 88 to 98
* **Greedy Decode (Single-path) - Orange:** The accuracy is constant at approximately 95%.
* **Self Consistency (Multi-path) - Blue:** The accuracy starts at approximately 89% at 0 sampled chains, rises sharply to approximately 97% at 10 sampled chains, and then plateaus around 98% with minor fluctuations.
**5. SVAMP**
* **Y-axis:** 70 to 87.5
* **Greedy Decode (Single-path) - Orange:** The accuracy is constant at approximately 80%.
* **Self Consistency (Multi-path) - Blue:** The accuracy starts at approximately 72% at 0 sampled chains, rises sharply to approximately 85% at 10 sampled chains, and then plateaus around 86-87% with minor fluctuations.
**6. GSM8K**
* **Y-axis:** 50 to 75
* **Greedy Decode (Single-path) - Orange:** The accuracy is constant at approximately 57%.
* **Self Consistency (Multi-path) - Blue:** The accuracy starts at approximately 50% at 0 sampled chains, rises sharply to approximately 68% at 10 sampled chains, and then continues to increase gradually to approximately 74% at 40 sampled chains.
**7. Commonsense QA**
* **Y-axis:** 74 to 81
* **Greedy Decode (Single-path) - Orange:** The accuracy is constant at approximately 79%.
* **Self Consistency (Multi-path) - Blue:** The accuracy starts at approximately 75% at 0 sampled paths, rises sharply to approximately 80% at 5 sampled paths, and then plateaus around 80-81% with minor fluctuations.
**8. Strategy QA**
* **Y-axis:** 74 to 82
* **Greedy Decode (Single-path) - Orange:** The accuracy is constant at approximately 76%.
* **Self Consistency (Multi-path) - Blue:** The accuracy starts at approximately 75% at 0 sampled paths, rises sharply to approximately 81% at 5 sampled paths, and then plateaus around 81-82% with minor fluctuations.
**9. ARC (Easy)**
* **Y-axis:** 88 to 96
* **Greedy Decode (Single-path) - Orange:** The accuracy is constant at approximately 91%.
* **Self Consistency (Multi-path) - Blue:** The accuracy starts at approximately 89% at 0 sampled paths, rises sharply to approximately 96% at 5 sampled paths, and then plateaus around 96% with minor fluctuations.
**10. ARC (Challenge)**
* **Y-axis:** 78 to 88
* **Greedy Decode (Single-path) - Orange:** The accuracy is constant at approximately 85%.
* **Self Consistency (Multi-path) - Blue:** The accuracy starts at approximately 79% at 0 sampled paths, rises sharply to approximately 87% at 5 sampled paths, and then plateaus around 88% with minor fluctuations.
### Key Observations
* For all datasets, the "Self Consistency (Multi-path)" method generally outperforms the "Greedy Decode (Single-path)" method, especially as the number of sampled reasoning chains/paths increases.
* The "Greedy Decode (Single-path)" method shows a relatively constant accuracy regardless of the number of sampled reasoning chains/paths.
* The "Self Consistency (Multi-path)" method shows a significant initial increase in accuracy with a small number of sampled reasoning chains/paths (typically up to 10), after which the accuracy plateaus or increases only marginally.
* The performance difference between the two methods varies across datasets.
### Interpretation
The data suggests that using a self-consistency approach with multiple reasoning paths significantly improves the accuracy of the models on these datasets compared to a greedy decoding approach with a single path. The initial increase in accuracy with a small number of sampled paths indicates that exploring multiple reasoning paths is beneficial, but the diminishing returns suggest that there is a limit to the benefits of increasing the number of sampled paths. The consistent performance of the greedy decoding method implies that it may be less sensitive to the complexity of the reasoning process and more reliant on the inherent structure of the dataset. The varying performance differences across datasets highlight the importance of choosing the appropriate method based on the specific characteristics of the task.
DECODING INTELLIGENCE...
EXPERT: gemini-3.1-flash-lite-preview-free VERSION 1
RUNTIME: google-free/gemini-3.1-flash-lite-preview
INTEL_VERIFIED
## Line Charts: Comparison of Greedy Decode vs. Self-Consistency Accuracy
### Overview
This image displays a grid of 10 line charts comparing the performance of two decoding strategies—"Greedy Decode (Single-path)" and "Self Consistency (Multi-path)"—across 10 different reasoning datasets. The charts are arranged in a 3-row, 4-column layout (with the bottom row containing 4 charts and the top two rows containing 3 charts each). Each chart plots "Accuracy (%)" against the number of sampled reasoning chains/paths.
### Components/Axes
* **X-Axis:** Labeled "#Sampled Reasoning Chains" (top two rows) and "#Sampled Reasoning Paths" (bottom row). The scale is consistent across all charts: 0, 5, 10, 15, 20, 25, 30, 35, 40.
* **Y-Axis:** Labeled "Accuracy (%)". The scale varies per chart to accommodate the specific performance range of the dataset.
* **Legend:** Located in the top-right (AQuA), middle-right (GSM8K), and bottom-right (ARC (Challenge)) charts.
* **Orange Line/Dots:** "Greedy Decode (Single-path)". This is a horizontal line indicating constant accuracy regardless of sampling.
* **Blue Line/Dots:** "Self Consistency (Multi-path)". This line includes vertical error bars and generally slopes upward, indicating increased accuracy with more samples.
### Detailed Analysis
The charts are organized by dataset. Below is the analysis for each:
**Row 1:**
1. **AddSub:**
* Greedy Decode: Constant at ~92%.
* Self Consistency: Starts at ~86% (at 0 samples), rises sharply to ~94% at 10 samples, then plateaus slightly above the Greedy line.
2. **ASDiv:**
* Greedy Decode: Constant at ~74%.
* Self Consistency: Starts at ~72%, rises steadily to ~82% at 40 samples.
3. **AQuA:**
* Greedy Decode: Constant at ~36%.
* Self Consistency: Starts at ~33%, rises continuously to ~48% at 40 samples.
**Row 2:**
4. **MultiArith:**
* Greedy Decode: Constant at ~95%.
* Self Consistency: Starts at ~89%, rises sharply to ~98% at 10 samples, then continues a slight upward trend to ~99% at 40 samples.
5. **SVAMP:**
* Greedy Decode: Constant at ~79%.
* Self Consistency: Starts at ~72%, rises sharply to ~85% at 10 samples, then continues a slower upward trend to ~87% at 40 samples.
6. **GSM8K:**
* Greedy Decode: Constant at ~57%.
* Self Consistency: Starts at ~50%, rises sharply to ~64% at 5 samples, ~69% at 10 samples, and continues to ~75% at 40 samples.
**Row 3:**
7. **Commonsense QA:**
* Greedy Decode: Constant at ~79%.
* Self Consistency: Starts at ~75%, rises to ~80% at 10 samples, then plateaus at ~81% at 40 samples.
8. **Strategy QA:**
* Greedy Decode: Constant at ~75%.
* Self Consistency: Starts at ~74%, rises to ~80% at 10 samples, then continues to ~82% at 40 samples.
9. **ARC (Easy):**
* Greedy Decode: Constant at ~95%.
* Self Consistency: Starts at ~88%, rises sharply to ~96% at 10 samples, then plateaus at ~97% at 40 samples.
10. **ARC (Challenge):**
* Greedy Decode: Constant at ~85%.
* Self Consistency: Starts at ~78%, rises sharply to ~87% at 5 samples, then continues to ~89% at 40 samples.
### Key Observations
* **Consistent Superiority:** In every single dataset, the "Self Consistency" method eventually outperforms the "Greedy Decode" method.
* **The "Cold Start" Problem:** At 0 samples (or the initial data point), the Self Consistency method often starts with lower accuracy than the Greedy Decode baseline.
* **Diminishing Returns:** The most significant accuracy gains for the Self Consistency method occur between 0 and 10-15 samples. Beyond 20 samples, the curve typically flattens, suggesting that increasing the number of samples further yields marginal improvements.
* **Error Bars:** The blue lines consistently feature error bars, which are largest at the lower end of the sampling range (0-5) and generally shrink as the number of samples increases, indicating higher confidence/stability with more samples.
### Interpretation
The data demonstrates the effectiveness of "Self-Consistency" as a decoding strategy for Large Language Models (LLMs) on reasoning tasks.
* **Ensemble Effect:** By sampling multiple reasoning chains (Multi-path) and selecting the most consistent answer, the model effectively performs an ensemble operation. This mitigates the risk of a single "hallucinated" or incorrect reasoning path (which is what Greedy Decode relies on).
* **Reliability:** The shrinking error bars as the number of samples increases suggest that the model's output becomes more stable and reliable with higher sampling counts.
* **Practical Application:** The "elbow" in the curves (typically around 10-20 samples) suggests an optimal trade-off point between computational cost (more samples = more compute) and accuracy gains. For most of these tasks, sampling beyond 20 chains provides diminishing returns.
DECODING INTELLIGENCE...
EXPERT: nemotron-free VERSION 1
RUNTIME: free/nvidia/nemotron-nano-12b-v2-vl:free
INTEL_VERIFIED
## Line Graphs: Accuracy Comparison Across Tasks
### Overview
The image contains 9 line graphs comparing the accuracy of two reasoning methods ("Greedy Decode" and "Self Consistency") across different tasks (e.g., AddSub, ASDiv, AQuA). Each graph plots accuracy (%) against the number of sampled reasoning chains/paths (0–40). The graphs are arranged in a 3x3 grid, with tasks labeled at the top of each subplot.
---
### Components/Axes
- **X-Axes**:
- Labeled "#Sampled Reasoning Chains" (for most graphs) or "#Sampled Reasoning Paths" (for QA tasks).
- Scale: 0 to 40 in increments of 5.
- **Y-Axes**:
- Labeled "Accuracy (%)".
- Scale: Varies by task (e.g., 70–98% for AddSub, 30–48% for AQuA).
- **Legends**:
- Positioned at the top-right of each graph.
- Colors:
- Orange: "Greedy Decode (Single-path)"
- Blue: "Self Consistency (Multi-path)"
- **Task Labels**:
- Top of each graph (e.g., "AddSub", "ASDiv", "AQuA", "MultiArith", "SVAMP", "GSM8K", "Commonsense QA", "Strategy QA", "ARC (Easy)", "ARC (Challenge)").
---
### Detailed Analysis
#### AddSub
- **Greedy Decode**: Flat line at ~92% accuracy across all sampled chains.
- **Self Consistency**: Starts at ~86% (0 chains), rises sharply to ~94% by 5 chains, then plateaus.
#### ASDiv
- **Greedy Decode**: Flat line at ~74% accuracy.
- **Self Consistency**: Starts at ~72%, increases gradually to ~82% by 40 chains.
#### AQuA
- **Greedy Decode**: Flat line at ~36% accuracy.
- **Self Consistency**: Starts at ~33%, rises to ~48% by 40 chains.
#### MultiArith
- **Greedy Decode**: Flat line at ~94% accuracy.
- **Self Consistency**: Starts at ~90%, increases to ~98% by 40 chains.
#### SVAMP
- **Greedy Decode**: Flat line at ~75% accuracy.
- **Self Consistency**: Starts at ~70%, rises to ~87.5% by 40 chains.
#### GSM8K
- **Greedy Decode**: Flat line at ~65% accuracy.
- **Self Consistency**: Starts at ~55%, increases to ~75% by 40 chains.
#### Commonsense QA
- **Greedy Decode**: Flat line at ~78% accuracy.
- **Self Consistency**: Starts at ~74%, rises to ~81% by 40 chains.
#### Strategy QA
- **Greedy Decode**: Flat line at ~80% accuracy.
- **Self Consistency**: Starts at ~76%, increases to ~82% by 40 chains.
#### ARC (Easy)
- **Greedy Decode**: Flat line at ~94% accuracy.
- **Self Consistency**: Starts at ~88%, rises to ~96% by 40 chains.
#### ARC (Challenge)
- **Greedy Decode**: Flat line at ~84% accuracy.
- **Self Consistency**: Starts at ~78%, increases to ~88% by 40 chains.
---
### Key Observations
1. **Self Consistency (blue) outperforms Greedy Decode (orange)** in all tasks where the number of sampled chains increases. The gap widens as more chains are sampled.
2. **Tasks with higher baseline accuracy** (e.g., AddSub, MultiArith) show smaller improvements for Self Consistency compared to tasks with lower baselines (e.g., AQuA, GSM8K).
3. **ARC (Challenge)** has the largest absolute improvement (~10% accuracy gain) for Self Consistency.
4. **Greedy Decode** remains static across all tasks, suggesting it does not benefit from additional reasoning chains.
---
### Interpretation
The data demonstrates that **Self Consistency (multi-path reasoning)** consistently improves accuracy as more reasoning chains are sampled, while **Greedy Decode (single-path)** remains unchanged. This implies:
- Multi-path reasoning explores diverse logical paths, enhancing performance in complex tasks.
- Greedy Decode’s static performance highlights its limitation in handling tasks requiring iterative or adaptive reasoning.
- Tasks like AQuA and GSM8K (with lower baseline accuracy) benefit more from multi-path exploration, suggesting they involve higher reasoning complexity.
The results align with prior work showing that self-consistency improves robustness in language models by reducing reliance on single, potentially error-prone reasoning paths.
DECODING INTELLIGENCE...