TECHNICAL ASSET FINGERPRINT
cdf92e76916c3d2cc4d057a7
Click to view fullscreen
Press ESC or click to close
FOUND IN PAPERS
EXPERT: healer-alpha-free VERSION 1
RUNTIME: free/openrouter/healer-alpha
INTEL_VERIFIED
## Line Charts: Performance of Greedy Decode vs. Self Consistency Across 10 Reasoning Tasks
### Overview
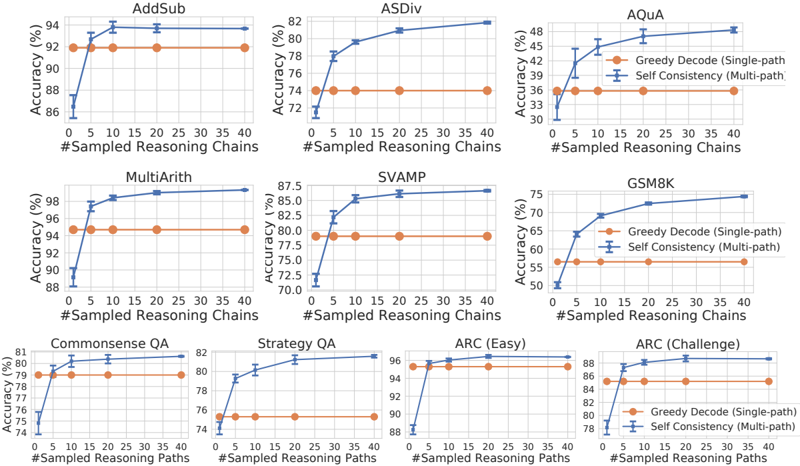
The image displays a grid of 10 line charts, each comparing the accuracy of two methods—"Greedy Decode (Single-path)" and "Self Consistency (Multi-path)"—across different reasoning tasks as the number of sampled reasoning chains/paths increases. The charts are arranged in three rows: three in the top row, three in the middle, and four in the bottom row.
### Components/Axes
* **Titles (Top of each chart):** AddSub, ASDiv, AQuA, MultiArith, SVAMP, GSM8K, Commonsense QA, Strategy QA, ARC (Easy), ARC (Challenge).
* **X-Axis Label:** "#Sampled Reasoning Chains" (for the first 6 charts) or "#Sampled Reasoning Paths" (for the last 4 charts).
* **X-Axis Scale:** Linear scale from 0 to 40, with major tick marks at 0, 5, 10, 15, 20, 25, 30, 35, 40.
* **Y-Axis Label:** "Accuracy (%)" for all charts.
* **Y-Axis Scale:** Varies per chart to fit the data range (see detailed analysis below).
* **Legend:** Located in the top-right corner of the AQuA chart and the bottom-right corner of the ARC (Challenge) chart.
* **Orange Line with Circle Markers:** "Greedy Decode (Single-path)"
* **Blue Line with 'X' Markers and Error Bars:** "Self Consistency (Multi-path)"
### Detailed Analysis
**Row 1:**
1. **AddSub:**
* **Y-Axis Range:** 86% to 94%.
* **Greedy Decode (Orange):** Flat line at approximately 92%.
* **Self Consistency (Blue):** Starts at ~86% (0 chains), rises sharply to ~93% (5 chains), then plateaus near 94% (10-40 chains). Error bars are small.
2. **ASDiv:**
* **Y-Axis Range:** 72% to 82%.
* **Greedy Decode (Orange):** Flat line at approximately 74%.
* **Self Consistency (Blue):** Starts at ~72% (0 chains), rises steeply to ~78% (5 chains), continues to ~80% (10 chains), and reaches ~82% (40 chains). Error bars are visible.
3. **AQuA:**
* **Y-Axis Range:** 30% to 48%.
* **Greedy Decode (Orange):** Flat line at approximately 36%.
* **Self Consistency (Blue):** Starts at ~30% (0 chains), rises to ~42% (5 chains), ~45% (10 chains), and plateaus near 48% (20-40 chains). Error bars are present.
**Row 2:**
4. **MultiArith:**
* **Y-Axis Range:** 88% to 98%.
* **Greedy Decode (Orange):** Flat line at approximately 95%.
* **Self Consistency (Blue):** Starts at ~88% (0 chains), jumps to ~97% (5 chains), and plateaus near 98% (10-40 chains). Error bars are small.
5. **SVAMP:**
* **Y-Axis Range:** 70% to 87.5%.
* **Greedy Decode (Orange):** Flat line at approximately 79%.
* **Self Consistency (Blue):** Starts at ~72% (0 chains), rises to ~85% (5 chains), ~86% (10 chains), and plateaus near 87.5% (20-40 chains). Error bars are visible.
6. **GSM8K:**
* **Y-Axis Range:** 50% to 75%.
* **Greedy Decode (Orange):** Flat line at approximately 56%.
* **Self Consistency (Blue):** Starts at ~50% (0 chains), rises steeply to ~65% (5 chains), ~69% (10 chains), ~72% (20 chains), and reaches ~75% (40 chains). Error bars are present.
**Row 3:**
7. **Commonsense QA:**
* **Y-Axis Range:** 74% to 81%.
* **Greedy Decode (Orange):** Flat line at approximately 79%.
* **Self Consistency (Blue):** Starts at ~74% (0 chains), rises to ~80% (5 chains), and plateaus near 81% (10-40 chains). Error bars are small.
8. **Strategy QA:**
* **Y-Axis Range:** 74% to 82%.
* **Greedy Decode (Orange):** Flat line at approximately 76%.
* **Self Consistency (Blue):** Starts at ~74% (0 chains), rises to ~80% (5 chains), ~81% (10 chains), and plateaus near 82% (20-40 chains). Error bars are visible.
9. **ARC (Easy):**
* **Y-Axis Range:** 88% to 96%.
* **Greedy Decode (Orange):** Flat line at approximately 95%.
* **Self Consistency (Blue):** Starts at ~88% (0 chains), jumps to ~95% (5 chains), and plateaus near 96% (10-40 chains). Error bars are very small.
10. **ARC (Challenge):**
* **Y-Axis Range:** 78% to 88%.
* **Greedy Decode (Orange):** Flat line at approximately 85%.
* **Self Consistency (Blue):** Starts at ~78% (0 chains), rises to ~86% (5 chains), ~87% (10 chains), and plateaus near 88% (20-40 chains). Error bars are present.
### Key Observations
1. **Consistent Superiority:** In all 10 tasks, the "Self Consistency (Multi-path)" method (blue line) achieves higher final accuracy than the "Greedy Decode (Single-path)" method (orange line).
2. **Diminishing Returns:** The performance gain from Self Consistency is most dramatic when increasing from 0 to 5 or 10 sampled chains/paths. After approximately 10-20 samples, the accuracy curves plateau, showing minimal further improvement.
3. **Baseline Performance:** The Greedy Decode accuracy is constant (flat line) across all sample counts, as it represents a single-path baseline unaffected by the number of samples.
4. **Task Difficulty:** The absolute accuracy levels vary significantly by task, indicating differing inherent difficulty. For example, MultiArith and ARC (Easy) have accuracies in the mid-to-high 90s, while AQuA and GSM8K are in the 30-75% range.
5. **Variability:** The error bars on the Self Consistency lines indicate variability in performance across runs. Tasks like AQuA and GSM8K show larger error bars, suggesting less consistent gains from the method on those tasks compared to tasks like AddSub or MultiArith.
### Interpretation
The data strongly demonstrates the effectiveness of the "Self Consistency" decoding strategy over standard "Greedy Decode" for improving the accuracy of language models on a diverse set of reasoning tasks. The core principle is that sampling multiple reasoning paths and aggregating the final answers (likely via majority vote) is more robust than relying on a single, potentially flawed, chain of thought.
The observed trend of rapid initial improvement followed by a plateau is a classic example of diminishing returns. It suggests that while gathering a few diverse reasoning paths (5-10) captures most of the benefit, sampling beyond 20-30 paths adds computational cost for negligible accuracy gain. This has practical implications for deploying such methods, indicating an optimal operating point for efficiency.
The variation in baseline (Greedy Decode) accuracy and the magnitude of improvement from Self Consistency across tasks highlights that the method's benefit is not uniform. It appears most impactful on tasks where the single-path approach is less reliable (e.g., GSM8K, AQuA), potentially because these tasks have more complex reasoning steps where errors are more likely and diversity in sampling is more valuable. The smaller error bars on tasks with already high baseline accuracy (e.g., MultiArith) suggest the method consistently finds the correct answer when the model is already quite capable.
DECODING INTELLIGENCE...