## Heatmap: AUROC Performance Comparison
### Overview
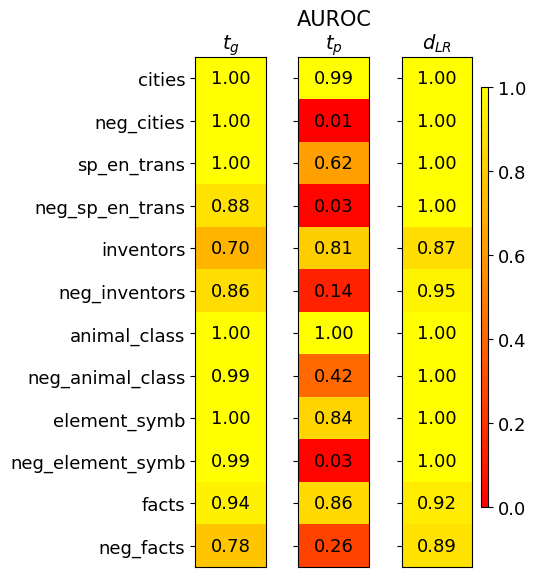
The image presents a heatmap comparing the Area Under the Receiver Operating Characteristic curve (AUROC) for different models (tg, tp, and dLR) across various categories. The heatmap uses a color gradient from red (low AUROC) to yellow (high AUROC) to visualize performance.
### Components/Axes
* **Title:** AUROC
* **Columns (Models):**
* $t_g$
* $t_p$
* $d_{LR}$
* **Rows (Categories):**
* cities
* neg\_cities
* sp\_en\_trans
* neg\_sp\_en\_trans
* inventors
* neg\_inventors
* animal\_class
* neg\_animal\_class
* element\_symb
* neg\_element\_symb
* facts
* neg\_facts
* **Color Scale (Legend):** Located on the right side of the heatmap, ranging from 0.0 (red) to 1.0 (yellow).
### Detailed Analysis or ### Content Details
Here's a breakdown of the AUROC values for each category and model:
* **cities:**
* $t_g$: 1.00 (yellow)
* $t_p$: 0.99 (yellow)
* $d_{LR}$: 1.00 (yellow)
* **neg\_cities:**
* $t_g$: 1.00 (yellow)
* $t_p$: 0.01 (red)
* $d_{LR}$: 1.00 (yellow)
* **sp\_en\_trans:**
* $t_g$: 1.00 (yellow)
* $t_p$: 0.62 (yellow-orange)
* $d_{LR}$: 1.00 (yellow)
* **neg\_sp\_en\_trans:**
* $t_g$: 0.88 (yellow)
* $t_p$: 0.03 (red)
* $d_{LR}$: 1.00 (yellow)
* **inventors:**
* $t_g$: 0.70 (yellow-orange)
* $t_p$: 0.81 (yellow)
* $d_{LR}$: 0.87 (yellow)
* **neg\_inventors:**
* $t_g$: 0.86 (yellow)
* $t_p$: 0.14 (red)
* $d_{LR}$: 0.95 (yellow)
* **animal\_class:**
* $t_g$: 1.00 (yellow)
* $t_p$: 1.00 (yellow)
* $d_{LR}$: 1.00 (yellow)
* **neg\_animal\_class:**
* $t_g$: 0.99 (yellow)
* $t_p$: 0.42 (orange)
* $d_{LR}$: 1.00 (yellow)
* **element\_symb:**
* $t_g$: 1.00 (yellow)
* $t_p$: 0.84 (yellow)
* $d_{LR}$: 1.00 (yellow)
* **neg\_element\_symb:**
* $t_g$: 0.99 (yellow)
* $t_p$: 0.03 (red)
* $d_{LR}$: 1.00 (yellow)
* **facts:**
* $t_g$: 0.94 (yellow)
* $t_p$: 0.86 (yellow)
* $d_{LR}$: 0.92 (yellow)
* **neg\_facts:**
* $t_g$: 0.78 (yellow-orange)
* $t_p$: 0.26 (red-orange)
* $d_{LR}$: 0.89 (yellow)
### Key Observations
* $d_{LR}$ consistently achieves high AUROC scores (close to 1.00) across all categories.
* $t_p$ shows significantly lower AUROC scores for the "neg\_" categories (neg\_cities, neg\_sp\_en\_trans, neg\_inventors, neg\_element\_symb), indicating poor performance in these cases.
* $t_g$ generally performs well, with AUROC scores mostly above 0.70.
### Interpretation
The heatmap suggests that the $d_{LR}$ model is the most robust and reliable across all tested categories. The $t_p$ model struggles with the "neg\_" categories, implying it may have difficulty distinguishing negative instances within those specific datasets. The $t_g$ model provides reasonably good performance, but not as consistently high as $d_{LR}$. The "neg\_" prefix likely indicates a negated or inverse relationship within the data, which $t_p$ fails to capture effectively. This could be due to the model's architecture or training data.