## Heatmap: AUROC Performance Comparison
### Overview
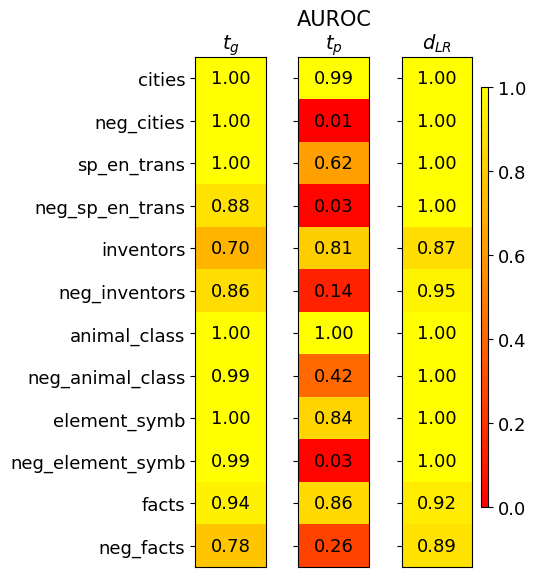
The image is a heatmap visualizing the Area Under the Receiver Operating Characteristic curve (AUROC) scores for three different methods or models, labeled `tg`, `tp`, and `dLR`, across a series of classification tasks. Each task has a positive and a negative variant (e.g., `cities` and `neg_cities`). The color scale indicates performance, ranging from red (0.0, poor) to yellow (1.0, perfect).
### Components/Axes
* **Title:** "AUROC" (centered at the top).
* **Column Headers (Methods):** Three columns labeled `tg`, `tp`, and `dLR` from left to right.
* **Row Labels (Tasks):** Twelve rows listed vertically on the left side. Each row represents a specific task, with its negated counterpart directly below it. The order is:
1. `cities`
2. `neg_cities`
3. `sp_en_trans`
4. `neg_sp_en_trans`
5. `inventors`
6. `neg_inventors`
7. `animal_class`
8. `neg_animal_class`
9. `element_symb`
10. `neg_element_symb`
11. `facts`
12. `neg_facts`
* **Color Scale/Legend:** A vertical color bar is positioned on the far right of the chart. It maps colors to AUROC values, with labeled ticks at 0.0 (red), 0.2, 0.4, 0.6, 0.8, and 1.0 (yellow).
* **Data Cells:** A 12x3 grid of colored cells. Each cell contains a numerical AUROC value (to two decimal places) and is colored according to the scale.
### Detailed Analysis
The following table reconstructs the data from the heatmap. Values are transcribed exactly as shown.
| Task | `tg` | `tp` | `dLR` |
|--------------------|-------|-------|-------|
| `cities` | 1.00 | 0.99 | 1.00 |
| `neg_cities` | 1.00 | 0.01 | 1.00 |
| `sp_en_trans` | 1.00 | 0.62 | 1.00 |
| `neg_sp_en_trans` | 0.88 | 0.03 | 1.00 |
| `inventors` | 0.70 | 0.81 | 0.87 |
| `neg_inventors` | 0.86 | 0.14 | 0.95 |
| `animal_class` | 1.00 | 1.00 | 1.00 |
| `neg_animal_class` | 0.99 | 0.42 | 1.00 |
| `element_symb` | 1.00 | 0.84 | 1.00 |
| `neg_element_symb` | 0.99 | 0.03 | 1.00 |
| `facts` | 0.94 | 0.86 | 0.92 |
| `neg_facts` | 0.78 | 0.26 | 0.89 |
**Trend Verification by Column:**
* **`tg` (Left Column):** The column is predominantly bright yellow, indicating consistently high performance. The trend is stable and high, with minor dips for `inventors` (0.70) and `neg_facts` (0.78).
* **`tp` (Middle Column):** This column shows extreme variation. It has high scores (yellow) for some positive tasks (`cities`: 0.99, `animal_class`: 1.00) but plummets to very low scores (deep red) for most negated tasks (`neg_cities`: 0.01, `neg_sp_en_trans`: 0.03, `neg_element_symb`: 0.03). The visual trend is a stark contrast between bright and dark cells.
* **`dLR` (Right Column):** Similar to `tg`, this column is mostly bright yellow, indicating robust high performance. It shows near-perfect scores (1.00) for many tasks and only slight reductions for `inventors` (0.87), `facts` (0.92), and `neg_facts` (0.89).
### Key Observations
1. **Performance Disparity in `tp`:** The `tp` method exhibits a dramatic performance collapse on negated task variants. For example, it scores 0.99 on `cities` but only 0.01 on `neg_cities`. This pattern repeats for `sp_en_trans` (0.62) vs. `neg_sp_en_trans` (0.03), and `element_symb` (0.84) vs. `neg_element_symb` (0.03).
2. **Robustness of `tg` and `dLR`:** Both the `tg` and `dLR` methods maintain high AUROC scores (mostly >0.85) across both positive and negated task variants, demonstrating significant robustness.
3. **Universal High Performance:** The `animal_class` task achieves a perfect or near-perfect score of 1.00 across all three methods, suggesting it is the easiest task among those presented.
4. **Most Challenging Task:** The `inventors` task appears to be the most challenging for the `tg` method (score: 0.70), while `neg_facts` is challenging for `tp` (0.26).
### Interpretation
This heatmap likely compares the generalization or robustness of three different models or training techniques (`tg`, `tp`, `dLR`) on a set of classification benchmarks that include negated versions of standard tasks.
The data strongly suggests that the `tp` method is highly sensitive to the framing of the task, failing catastrophically when presented with negated concepts. This could indicate a failure in logical reasoning or an over-reliance on superficial statistical patterns that are inverted in the negated examples.
In contrast, `tg` and `dLR` appear to learn more robust, abstract representations that are invariant to such linguistic or logical negation. Their consistently high performance implies they have captured the underlying semantic or structural features of the tasks.
The investigation points to a critical evaluation of model capabilities: achieving high accuracy on standard tasks (`cities`, `element_symb`) is insufficient if the model fails on logically equivalent but differently framed problems (`neg_cities`, `neg_element_symb`). The `tp` model's performance profile is a classic sign of a lack of robustness, while `tg` and `dLR` demonstrate the desired generalization.