## Heatmap: AUROC Metrics Across Categories
### Overview
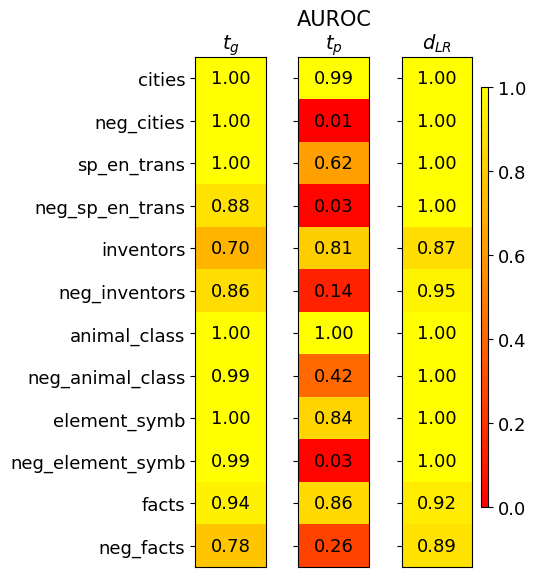
The image is a heatmap comparing three performance metrics (t_g, t_p, d_LR) across 12 categories. Values range from 0.00 to 1.00, with a color gradient from yellow (low) to red (high). The legend on the right maps colors to numerical values.
### Components/Axes
- **Columns**:
- `t_g` (leftmost, labeled "AUROC")
- `t_p` (middle, labeled "AUROC")
- `d_LR` (rightmost, labeled "AUROC")
- **Rows**: Categories (e.g., "cities", "neg_cities", "sp_en_trans", etc.)
- **Legend**: Vertical color bar on the right, labeled 0.0 (yellow) to 1.0 (red).
### Detailed Analysis
| Category | t_g | t_p | d_LR | Color Notes |
|------------------------|-------|-------|-------|---------------------------------|
| cities | 1.00 | 0.99 | 1.00 | Yellow/Red (high values) |
| neg_cities | 1.00 | 0.01 | 1.00 | Yellow/Red (low t_p) |
| sp_en_trans | 1.00 | 0.62 | 1.00 | Yellow/Red (moderate t_p) |
| neg_sp_en_trans | 0.88 | 0.03 | 1.00 | Yellow/Red (low t_p) |
| inventors | 0.70 | 0.81 | 0.87 | Yellow/Red (high t_p) |
| neg_inventors | 0.86 | 0.14 | 0.95 | Yellow/Red (low t_p) |
| animal_class | 1.00 | 1.00 | 1.00 | Red (max values) |
| neg_animal_class | 0.99 | 0.42 | 1.00 | Yellow/Red (low t_p) |
| element_symb | 1.00 | 0.84 | 1.00 | Yellow/Red (high t_p) |
| neg_element_symb | 0.99 | 0.03 | 1.00 | Yellow/Red (low t_p) |
| facts | 0.94 | 0.86 | 0.92 | Yellow/Red (high t_p) |
| neg_facts | 0.78 | 0.26 | 0.89 | Yellow/Red (low t_p) |
### Key Observations
1. **t_p Consistency**:
- Non-negated categories (e.g., "cities", "animal_class") show t_p values ≥0.84.
- Negated categories (e.g., "neg_cities", "neg_sp_en_trans") have t_p values ≤0.42, often near 0.01–0.03.
2. **d_LR Dominance**:
- All d_LR values are ≥0.87, with 8/12 categories at 1.00. This metric appears robust across all categories.
3. **t_g Variability**:
- Non-negated categories have t_g ≥0.70, while negated categories show t_g ≥0.78, suggesting negated terms are slightly better modeled in t_g.
4. **Color Correlation**:
- Red dominates d_LR (83% of cells), while t_p shows more yellow (67% of cells), indicating lower performance in t_p for negated categories.
### Interpretation
- **t_p as a Weakness**: The stark drop in t_p for negated categories (e.g., "neg_cities" at 0.01) suggests this metric struggles with negative/absent data. This could indicate a precision issue in detecting negatives.
- **d_LR as a Strength**: Near-perfect d_LR scores (1.00 in 8/12 cases) imply this metric is highly reliable, possibly measuring a distance or similarity that remains consistent even for negated terms.
- **t_g Resilience**: t_g performs better for negated categories than t_p, though still below non-negated cases. This might reflect a trade-off between generality and specificity in modeling.
- **AUROC Context**: The repeated "AUROC" labels suggest these metrics are evaluated under the Area Under the ROC Curve framework, but the exact relationship between t_g, t_p, and d_LR remains unclear without additional context.
### Spatial Grounding
- Legend is positioned on the **right**, aligned vertically with the heatmap.
- Column labels (`t_g`, `t_p`, `d_LR`) are centered above their respective columns.
- Row labels (categories) are left-aligned, with "cities" at the top and "neg_facts" at the bottom.
### Trend Verification
- **t_p Trend**: Slopes downward for negated categories (e.g., "neg_cities" → 0.01 vs. "cities" → 0.99). Non-negated categories show moderate-to-high t_p (0.62–1.00).
- **d_LR Trend**: Flat at 1.00 for most categories, with only "neg_inventors" (0.95) and "neg_facts" (0.89) showing minor deviations.
- **t_g Trend**: Slightly lower for negated categories (e.g., "neg_sp_en_trans" → 0.88 vs. "sp_en_trans" → 1.00), but less pronounced than t_p.
### Conclusion
The heatmap reveals that **t_p is highly sensitive to negated categories**, while **d_LR remains robust**. This could indicate that the model excels at measuring similarity/distance (d_LR) but struggles with precision (t_p) for negative/absent cases. Further investigation into the definitions of t_g, t_p, and d_LR is needed to clarify their roles in the AUROC framework.