## Data Flow Diagram: Knowledge Graph Creation
### Overview
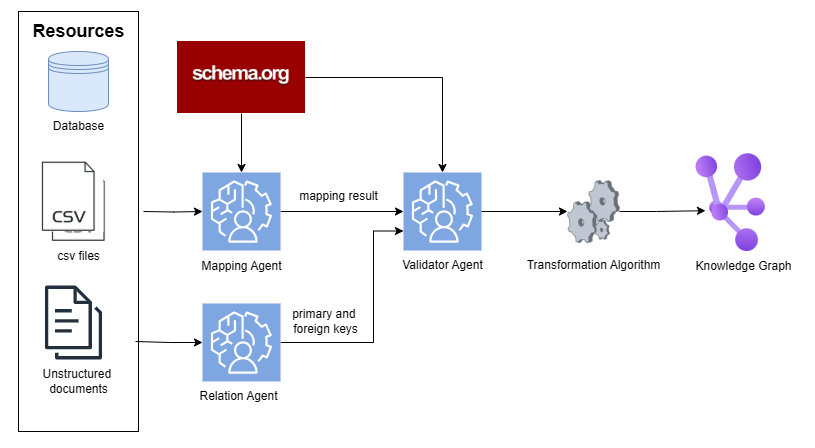
The image is a data flow diagram illustrating the process of creating a knowledge graph from various data sources. It shows how data from databases, CSV files, and unstructured documents are processed through a series of agents and algorithms to ultimately form a knowledge graph.
### Components/Axes
* **Resources (Left Side):**
* Database (represented by a cylinder icon)
* CSV files (represented by a document icon labeled "CSV")
* Unstructured documents (represented by a document icon with lines)
* **Processing Agents (Center):**
* Mapping Agent (blue square icon with a brain/gear symbol)
* Relation Agent (blue square icon with a brain/gear symbol)
* Validator Agent (blue square icon with a brain/gear symbol)
* **External Resource (Top-Center):**
* schema.org (red rectangle)
* **Transformation Algorithm (Center-Right):**
* Transformation Algorithm (two interlocking gears)
* **Output (Right Side):**
* Knowledge Graph (purple node-link diagram)
* **Flow Arrows:** Arrows indicate the direction of data flow between components.
* **Labels:** Text labels describe each component and the data being passed between them.
### Detailed Analysis or ### Content Details
1. **Resources:**
* Database: A generic database icon.
* CSV files: Represented by a document icon with the label "CSV" and the text "csv files" below.
* Unstructured documents: Represented by a document icon with lines, labeled "Unstructured documents".
2. **Mapping Agent:**
* Receives input from: CSV files and schema.org.
* Outputs: "mapping result" to the Validator Agent.
3. **Relation Agent:**
* Receives input from: Unstructured documents.
* Outputs: "primary and foreign keys" to the Validator Agent.
4. **Schema.org:**
* Provides input to the Mapping Agent and Validator Agent.
5. **Validator Agent:**
* Receives input from: Mapping Agent, Relation Agent, and schema.org.
* Outputs: Data to the Transformation Algorithm.
6. **Transformation Algorithm:**
* Receives input from: Validator Agent.
* Outputs: Data to the Knowledge Graph.
7. **Knowledge Graph:**
* Final output, represented by a purple node-link diagram.
### Key Observations
* The diagram illustrates a pipeline architecture for knowledge graph creation.
* Multiple data sources are integrated and processed.
* Schema.org plays a central role in the mapping and validation process.
* The flow is sequential, from data sources to the final knowledge graph.
### Interpretation
The diagram depicts a common approach to building knowledge graphs. It highlights the importance of data integration, schema mapping, and validation in creating a structured representation of knowledge from diverse sources. The use of schema.org suggests a focus on semantic web technologies and standardized vocabularies. The process involves transforming raw data into a structured knowledge graph, which can then be used for various applications such as data analysis, information retrieval, and reasoning. The diagram emphasizes the flow of information and the transformations applied at each stage.