## Diagram: Visual Representation Strategies (Part b)
### Overview
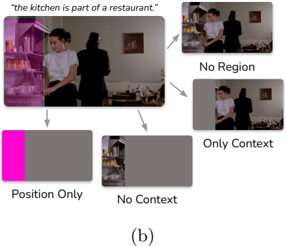
This image is a conceptual diagram, labeled "(b)," illustrating four distinct methods for representing visual data in the context of a scene. It uses a base image of a kitchen to demonstrate how different visual information (region, context, position) can be isolated or presented for analysis, likely within the field of computer vision or machine learning.
### Components/Axes
* **Main Image (Top Left):** The source image depicting a woman in a white shirt and a person in black in a kitchen. A magenta/pink semi-transparent overlay covers the left portion of the image, highlighting the kitchen area.
* **Text Header:** "the kitchen is part of a restaurant." positioned above the main image.
* **Arrows:** Four gray arrows originate from the main image, pointing to four distinct sub-diagrams.
* **Sub-diagrams:**
* **"No Region" (Top Right):** Displays the full, unaltered original image.
* **"Only Context" (Middle Right):** Displays the full, unaltered original image.
* **"Position Only" (Bottom Left):** Displays a gray rectangle with a magenta/pink block on the left side, representing the spatial location of the kitchen.
* **"No Context" (Bottom Center):** Displays the visual content of the kitchen (the magenta part from the main image) on the left, with a gray block on the right.
* **Footer:** "(b)" centered at the bottom.
### Detailed Analysis
* **Main Image:** The magenta overlay serves as a mask or Region of Interest (ROI) indicator, defining the "kitchen" area.
* **"No Region" vs. "Only Context":** Both sub-diagrams show the full, original image. The distinction is conceptual rather than visual; "No Region" implies the absence of a specific bounding box or mask, while "Only Context" implies the focus is on the environment surrounding the subject.
* **"Position Only":** This diagram abstracts the visual data into a geometric representation. The magenta block corresponds to the spatial coordinates of the kitchen, while the gray area represents the rest of the frame, effectively removing all visual detail to focus purely on spatial location.
* **"No Context":** This diagram isolates the visual content of the kitchen (the magenta region) and replaces the surrounding environment with a neutral gray block. This removes the environmental context to focus solely on the object/region itself.
### Key Observations
* **Consistent Color Coding:** The magenta/pink color is used consistently across the main image, the "Position Only" diagram, and the "No Context" diagram to denote the specific region of interest (the kitchen).
* **Visual Redundancy:** The "No Region" and "Only Context" sub-diagrams are visually identical, indicating that the difference between these categories is defined by the labeling or training methodology rather than the visual input itself.
* **Abstraction Spectrum:** The diagram moves from full visual information (top/middle right) to abstract spatial information (bottom left) and isolated visual information (bottom center).
### Interpretation
This diagram illustrates a taxonomy of visual representation techniques used to train or evaluate computer vision models. It demonstrates how a model might be taught to understand the relationship between an object ("the kitchen") and its environment ("a restaurant").
By breaking down the scene into these four categories, the diagram highlights the trade-offs in data representation:
1. **Full Scene:** Provides maximum context but lacks specific focus.
2. **Position Only:** Provides spatial awareness but lacks visual detail.
3. **No Context:** Provides visual detail but lacks environmental awareness.
The diagram suggests that understanding a scene requires a combination of these approaches, or that different tasks (e.g., object detection vs. scene classification) require different levels of contextual and spatial information.