## Diagram: Contextual Processing Regions for Textual Prompt
### Overview
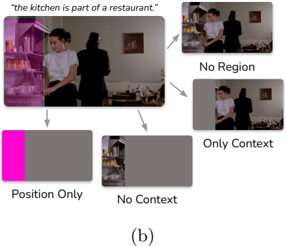
The diagram illustrates a system processing a textual prompt ("the kitchen is part of a restaurant") through four distinct regions: Position Only, No Context, Only Context, and No Region. Each region is visually differentiated by color (pink for Position Only, gray for others) and connected via arrows from a central image.
### Components/Axes
- **Text Prompt**: "the kitchen is part of a restaurant" (top of the diagram).
- **Central Image**: A scene showing a person in a kitchen environment (left side of the diagram).
- **Regions**:
- **Position Only**: Pink-shaded area (leftmost region).
- **No Context**: Gray-shaded area (second region).
- **Only Context**: Gray-shaded area (third region).
- **No Region**: Gray-shaded area (rightmost region).
- **Arrows**: Connect the central image to each region, indicating directional flow.
### Detailed Analysis
- **Text Prompt**: Explicitly states the input text for processing.
- **Central Image**: Visual representation of the scene described in the prompt.
- **Regions**:
- **Position Only**: Highlighted in pink, suggesting prioritization or unique processing logic.
- **No Context/Only Context/No Region**: Uniform gray shading implies shared processing characteristics or secondary focus.
### Key Observations
- The **Position Only** region is visually distinct (pink), while the remaining regions share identical gray shading.
- Arrows originate from the central image, indicating all regions derive input from the same source.
- No numerical data or quantitative metrics are present; the diagram focuses on categorical distinctions.
### Interpretation
The diagram likely represents a workflow for analyzing or generating outputs based on contextual and positional cues. The **Position Only** region’s unique coloration suggests it handles positional data independently, while the gray regions may process contextual or combined inputs. The absence of numerical values implies this is a conceptual or architectural diagram rather than a data-driven chart. The system appears to decompose the input prompt into distinct processing pathways, with Position Only as a critical component.