## Line Charts: Performance Metrics vs. Step for Different Group Sizes
### Overview
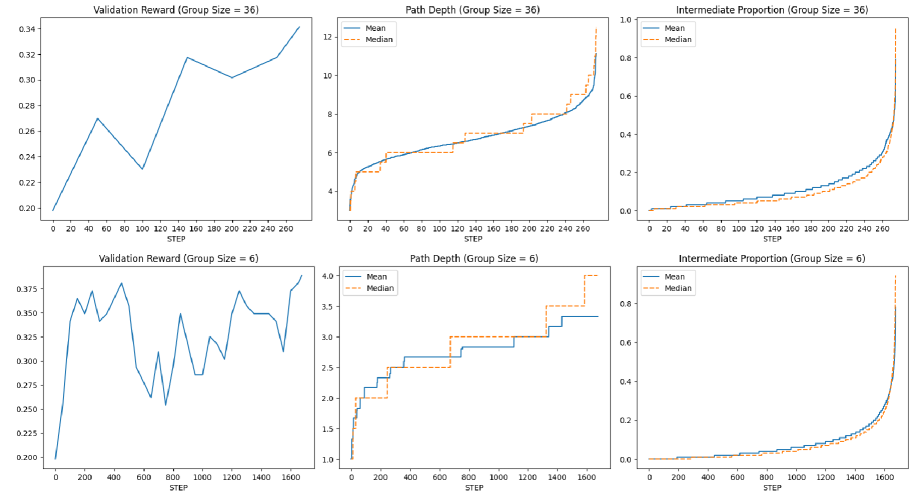
The image contains six line charts arranged in a 2x3 grid. Each row represents a different group size (36 and 6), and each column represents a different performance metric: Validation Reward, Path Depth, and Intermediate Proportion. Each chart plots the mean and median values of the metric against the step number.
### Components/Axes
**General Chart Elements:**
* **Titles:** Each chart has a title indicating the metric and group size (e.g., "Validation Reward (Group Size = 36)").
* **X-axis:** Labeled "STEP". The x-axis scales differ between the top and bottom rows. Top row ranges from 0 to 260. Bottom row ranges from 0 to 1600.
* **Y-axis:** Varies depending on the metric.
* **Legend:** Each chart includes a legend in the top-left corner indicating "Mean" (solid blue line) and "Median" (dashed orange line).
**Specific Axes:**
* **Validation Reward:**
* Y-axis (Group Size = 36): Ranges from 0.20 to 0.34.
* Y-axis (Group Size = 6): Ranges from 0.200 to 0.375.
* **Path Depth:**
* Y-axis (Group Size = 36): Ranges from 4 to 12.
* Y-axis (Group Size = 6): Ranges from 1.0 to 4.0.
* **Intermediate Proportion:**
* Y-axis (Group Size = 36): Ranges from 0.0 to 1.0.
* Y-axis (Group Size = 6): Ranges from 0.0 to 0.8.
### Detailed Analysis
**1. Validation Reward:**
* **(Group Size = 36):**
* **Mean (Blue):** The line starts at approximately 0.20 at step 0, increases to approximately 0.27 at step 40, dips to approximately 0.23 at step 80, then rises again to approximately 0.32 at step 160, dips slightly to approximately 0.30 at step 200, and ends at approximately 0.33 at step 260.
* **(Group Size = 6):**
* **Mean (Blue):** The line starts at approximately 0.20 at step 0, increases to approximately 0.37 at step 200, then fluctuates between approximately 0.26 and 0.37 until step 1600, ending at approximately 0.38.
**2. Path Depth:**
* **(Group Size = 36):**
* **Mean (Blue):** The line starts at approximately 4.0 at step 0, gradually increases with some plateaus, and ends at approximately 12 at step 260.
* **Median (Orange):** The line starts at approximately 5.0 at step 0, increases in a step-wise fashion, and ends at approximately 10 at step 260.
* **(Group Size = 6):**
* **Mean (Blue):** The line starts at approximately 1.0 at step 0, gradually increases with some plateaus, and ends at approximately 3.3 at step 1600.
* **Median (Orange):** The line starts at approximately 1.5 at step 0, increases in a step-wise fashion, and ends at approximately 4.0 at step 1600.
**3. Intermediate Proportion:**
* **(Group Size = 36):**
* **Mean (Blue):** The line starts at approximately 0.0 at step 0, gradually increases, and ends at approximately 0.95 at step 260.
* **Median (Orange):** The line starts at approximately 0.0 at step 0, gradually increases, and ends at approximately 0.75 at step 260.
* **(Group Size = 6):**
* **Mean (Blue):** The line starts at approximately 0.0 at step 0, gradually increases, and ends at approximately 0.25 at step 1600.
* **Median (Orange):** The line starts at approximately 0.0 at step 0, gradually increases, and ends at approximately 0.35 at step 1600.
### Key Observations
* The "Validation Reward" for Group Size 6 fluctuates more than for Group Size 36.
* "Path Depth" shows a step-wise increase for the median in both group sizes.
* "Intermediate Proportion" increases more rapidly for Group Size 36 than for Group Size 6.
* The x-axis scales are different for group sizes 36 and 6, making direct comparison difficult without normalization.
### Interpretation
The charts compare the performance of a model or system under two different group sizes (36 and 6) across three metrics: Validation Reward, Path Depth, and Intermediate Proportion. The "Validation Reward" indicates the model's accuracy or success. The "Path Depth" might represent the complexity of the solution or the number of steps taken to reach a result. The "Intermediate Proportion" could indicate the ratio of intermediate steps or states.
The data suggests that a larger group size (36) leads to a more stable validation reward and a higher intermediate proportion, while the path depth increases more rapidly. The smaller group size (6) shows more fluctuation in the validation reward and a slower increase in intermediate proportion. The step-wise increase in median path depth suggests discrete changes or levels in the solution complexity.
The different x-axis scales suggest that the model or system requires more steps to converge or reach a certain performance level with a smaller group size.