## Line Charts: Training Metrics Comparison (Group Size 36 vs. 6)
### Overview
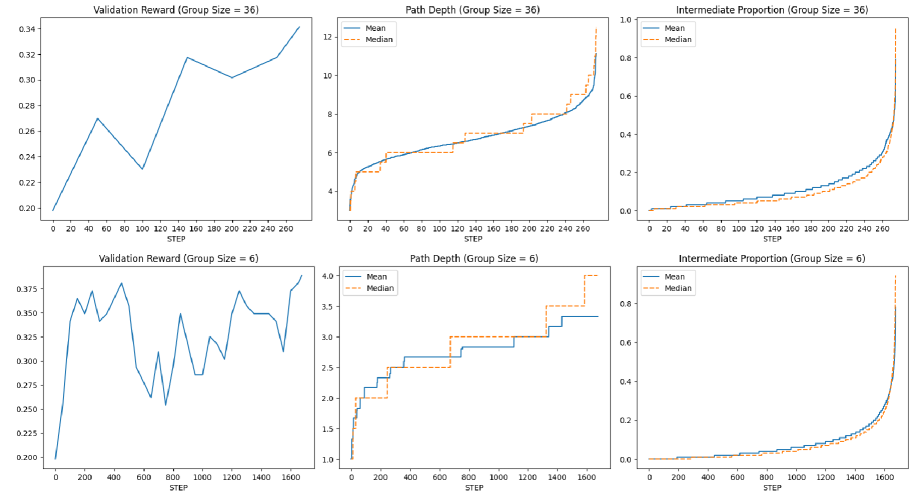
This image displays a 2x3 grid of line charts comparing three specific metrics—**Validation Reward**, **Path Depth**, and **Intermediate Proportion**—across two different experimental configurations: **Group Size = 36** (top row) and **Group Size = 6** (bottom row). The charts illustrate how these metrics evolve over the course of training steps.
### Components/Axes
* **Layout**: 2 rows, 3 columns.
* **Top Row (Group Size = 36)**: X-axis range is 0 to ~270 steps.
* **Bottom Row (Group Size = 6)**: X-axis range is 0 to ~1700 steps.
* **Axes**:
* **X-axis**: Labeled "STEP" for all charts.
* **Y-axis**: Varies by metric (Validation Reward, Path Depth, Intermediate Proportion).
* **Legends**:
* Present in "Path Depth" and "Intermediate Proportion" charts.
* **Mean**: Solid blue line.
* **Median**: Dashed orange line.
---
### Detailed Analysis
#### Top Row: Group Size = 36
1. **Validation Reward (Top-Left)**
* **Trend**: The line shows a general upward trend with a notable dip around step 100.
* **Data Points**: Starts at ~0.20 (step 0). Rises to ~0.27 (step 50), dips to ~0.23 (step 100), rises to ~0.32 (step 150), dips slightly to ~0.30 (step 200), and ends at ~0.34 (step 270).
2. **Path Depth (Top-Center)**
* **Trend**: Both Mean and Median lines slope upward. The Median line exhibits a "staircase" pattern, indicating discrete jumps in depth values.
* **Data Points**: Starts at ~3.5. At step 270, the Mean is ~9.5, while the Median is significantly higher at ~12.5.
3. **Intermediate Proportion (Top-Right)**
* **Trend**: Both lines show an exponential-like growth curve, starting near 0 and rapidly accelerating toward 1.0.
* **Data Points**: Starts at 0.0. At step 270, both Mean and Median converge near 1.0.
#### Bottom Row: Group Size = 6
1. **Validation Reward (Bottom-Left)**
* **Trend**: Highly volatile upward trend. The reward fluctuates significantly throughout the training process.
* **Data Points**: Starts at 0.20. Rapidly climbs to ~0.36 (step 200). Experiences a sharp drop to ~0.25 (step 750). Recovers and peaks at ~0.38 (step 1700).
2. **Path Depth (Bottom-Center)**
* **Trend**: Both lines show a step-like upward progression. The Median (orange) is consistently higher than the Mean (blue) after step 400.
* **Data Points**: Starts at 1.0. At step 1700, the Mean is ~3.3, while the Median reaches 4.0.
3. **Intermediate Proportion (Bottom-Right)**
* **Trend**: Similar to the top-right chart, this shows an exponential growth curve, but over a much longer step duration (1700 steps).
* **Data Points**: Starts at 0.0. At step 1700, the Mean is ~0.7, while the Median is higher, at ~0.9.
---
### Key Observations
* **Scale Disparity**: The "Group Size = 6" configuration allows for significantly more training steps (~1700) compared to "Group Size = 36" (~270). This suggests that smaller group sizes are computationally cheaper per step, allowing for longer training durations.
* **Volatility**: The "Validation Reward" for Group Size 6 is much more volatile than Group Size 36. This is typical in reinforcement learning where smaller batch sizes (or group sizes) introduce more noise into the gradient estimates.
* **Median vs. Mean**: In the "Path Depth" and "Intermediate Proportion" charts, the Median (orange dashed) is frequently higher than the Mean (blue solid), suggesting a right-skewed distribution of values in the underlying data.
### Interpretation
The data suggests an ablation study or hyperparameter tuning experiment comparing the effects of "Group Size" on model training dynamics.
* **Efficiency vs. Stability**: The Group Size 36 configuration reaches a reasonable reward (~0.34) very quickly (270 steps) with a smoother curve. The Group Size 6 configuration requires much longer training (1700 steps) to reach a slightly higher reward (~0.38), but the path to get there is noisy and unstable.
* **Convergence**: The "Intermediate Proportion" charts show that regardless of group size, the model eventually learns to maximize this proportion (approaching 1.0), though the rate of convergence is stretched over the different step scales.
* **Conclusion**: If computational resources are limited, Group Size 36 is likely the superior choice for rapid prototyping due to the smoother convergence. If the goal is to squeeze out maximum performance and the system can handle longer training times, Group Size 6 may be preferable, provided the volatility can be managed.