## Line Charts: Validation Metrics vs. Step
### Overview
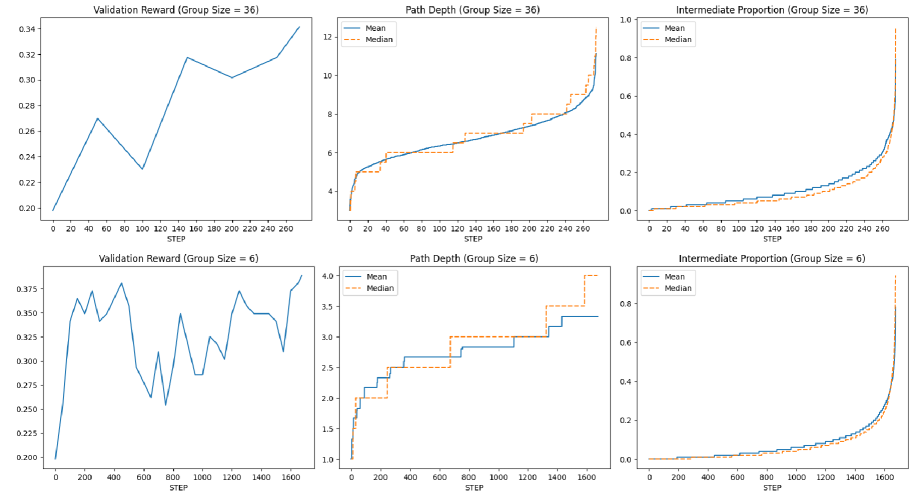
The image presents six line charts, arranged in a 2x3 grid, displaying validation metrics (Reward, Path Depth, and Intermediate Proportion) plotted against 'STEP'. Each metric is shown for two different group sizes: 36 and 6. Each chart displays both 'Mean' and 'Median' values as separate lines.
### Components/Axes
* **X-axis:** Labeled "STEP". The scale varies for each chart.
* Top row charts: 0 to 260
* Bottom row charts: 0 to 1600
* **Y-axis:** Varies depending on the metric.
* "Validation Reward": Scale approximately 0.20 to 0.34
* "Path Depth": Scale approximately 1.0 to 12.0
* "Intermediate Proportion": Scale approximately 0.0 to 1.0
* **Legend:** Located in the top-left corner of each chart.
* "Mean" - Solid line
* "Median" - Dashed line
* **Titles:** Each chart has a title indicating the metric and group size.
### Detailed Analysis or Content Details
**Chart 1: Validation Reward (Group Size = 36)**
* **Trend (Mean):** The blue 'Mean' line initially decreases from approximately 0.28 to a minimum of around 0.23 at STEP 60, then increases with fluctuations to a maximum of approximately 0.32 at STEP 240, and then decreases slightly to around 0.30 at STEP 260.
* **Data Points (Mean - approximate):**
* STEP 0: 0.28
* STEP 60: 0.23
* STEP 120: 0.26
* STEP 180: 0.29
* STEP 240: 0.32
* STEP 260: 0.30
* **Trend (Median):** The blue dashed 'Median' line is relatively stable, fluctuating between approximately 0.24 and 0.27 throughout the entire range.
* **Data Points (Median - approximate):**
* STEP 0: 0.26
* STEP 60: 0.24
* STEP 120: 0.25
* STEP 180: 0.26
* STEP 240: 0.27
* STEP 260: 0.26
**Chart 2: Path Depth (Group Size = 36)**
* **Trend (Mean):** The blue 'Mean' line shows a steep increase from approximately 4 to 10 between STEP 0 and STEP 120, then a slower increase to around 11.5 at STEP 260.
* **Data Points (Mean - approximate):**
* STEP 0: 4
* STEP 60: 7
* STEP 120: 10
* STEP 180: 10.5
* STEP 240: 11
* STEP 260: 11.5
* **Trend (Median):** The blue dashed 'Median' line follows a similar trend to the mean, but is slightly lower, increasing from approximately 4 to 9.5 at STEP 260.
* **Data Points (Median - approximate):**
* STEP 0: 4
* STEP 60: 6
* STEP 120: 8.5
* STEP 180: 9
* STEP 240: 9.5
* STEP 260: 9.5
**Chart 3: Intermediate Proportion (Group Size = 36)**
* **Trend (Mean):** The blue 'Mean' line increases rapidly from approximately 0.15 to 0.6 at STEP 120, then plateaus around 0.65 to 0.7.
* **Data Points (Mean - approximate):**
* STEP 0: 0.15
* STEP 60: 0.3
* STEP 120: 0.6
* STEP 180: 0.65
* STEP 240: 0.7
* STEP 260: 0.68
* **Trend (Median):** The blue dashed 'Median' line increases more slowly, reaching approximately 0.4 at STEP 260.
* **Data Points (Median - approximate):**
* STEP 0: 0.1
* STEP 60: 0.2
* STEP 120: 0.35
* STEP 180: 0.4
* STEP 240: 0.45
* STEP 260: 0.4
**Chart 4: Validation Reward (Group Size = 6)**
* **Trend (Mean):** The blue 'Mean' line fluctuates between approximately 0.24 and 0.36 throughout the entire range.
* **Data Points (Mean - approximate):**
* STEP 0: 0.26
* STEP 200: 0.34
* STEP 400: 0.28
* STEP 600: 0.32
* STEP 800: 0.25
* STEP 1000: 0.31
* STEP 1200: 0.27
* STEP 1400: 0.24
* STEP 1600: 0.30
* **Trend (Median):** The blue dashed 'Median' line is relatively stable, fluctuating between approximately 0.24 and 0.28.
**Chart 5: Path Depth (Group Size = 6)**
* **Trend (Mean):** The blue 'Mean' line increases steadily from approximately 1.0 to 3.8 at STEP 1600.
* **Data Points (Mean - approximate):**
* STEP 0: 1.0
* STEP 200: 1.8
* STEP 400: 2.5
* STEP 600: 3.0
* STEP 800: 3.2
* STEP 1000: 3.4
* STEP 1200: 3.6
* STEP 1400: 3.7
* STEP 1600: 3.8
* **Trend (Median):** The blue dashed 'Median' line follows a similar trend, but is slightly lower.
**Chart 6: Intermediate Proportion (Group Size = 6)**
* **Trend (Mean):** The blue 'Mean' line increases rapidly from approximately 0.0 to 0.8 at STEP 1600.
* **Data Points (Mean - approximate):**
* STEP 0: 0.0
* STEP 200: 0.2
* STEP 400: 0.4
* STEP 600: 0.6
* STEP 800: 0.7
* STEP 1000: 0.75
* STEP 1200: 0.78
* STEP 1400: 0.8
* STEP 1600: 0.8
### Key Observations
* The 'Validation Reward' for Group Size 36 shows a more pronounced initial dip and subsequent recovery compared to Group Size 6.
* 'Path Depth' increases consistently for both group sizes, but the rate of increase is higher for Group Size 36 in the initial stages.
* 'Intermediate Proportion' shows a faster increase for Group Size 36, reaching a higher plateau compared to Group Size 6.
* The 'Median' lines are generally more stable than the 'Mean' lines, indicating less variance in the data.
### Interpretation
The charts demonstrate the impact of group size on the validation metrics during a training or learning process. The larger group size (36) appears to lead to faster initial learning (as seen in 'Path Depth' and 'Intermediate Proportion') but also exhibits more volatility in the 'Validation Reward'. The smaller group size (6) shows more stable performance but slower learning. The difference in the 'Validation Reward' curves suggests that the larger group size might be more prone to overfitting or experiencing more significant fluctuations during training. The 'Intermediate Proportion' reaching a higher value for Group Size 36 suggests that the model is utilizing intermediate representations more effectively with a larger group size. The divergence between the 'Mean' and 'Median' lines indicates the presence of outliers or varying performance across individual instances within each group. These metrics likely represent the performance of a machine learning model, and the charts provide insights into the trade-offs between group size, learning speed, and stability.