## Line Charts: Performance Metrics Across Group Sizes (36 and 6)
### Overview
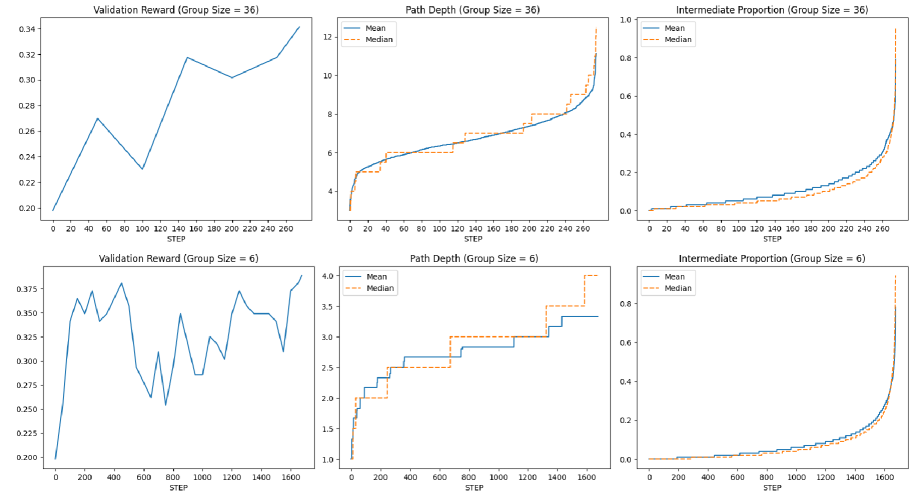
The image contains six line charts organized in a 2x3 grid, comparing three performance metrics (Validation Reward, Path Depth, Intermediate Proportion) across two group sizes (36 and 6). Each chart includes mean (solid blue) and median (dashed orange) trend lines, with x-axis labeled "STEP" and y-axis labeled with metric-specific values.
### Components/Axes
1. **X-Axis (STEP)**:
- Group Size 36: 0–250 steps (intervals of 50)
- Group Size 6: 0–1600 steps (intervals of 200)
2. **Y-Axes**:
- Validation Reward: 0.20–0.375 (Group 36) / 0.20–0.375 (Group 6)
- Path Depth: 4–12 (Group 36) / 1–4 (Group 6)
- Intermediate Proportion: 0–1 (both groups)
3. **Legends**:
- Top-right corner of each subplot
- Blue = Mean, Orange = Median
- Positioned consistently across all charts
### Detailed Analysis
#### Group Size 36
1. **Validation Reward**:
- Starts at ~0.20, fluctuates between 0.22–0.32, then rises sharply to ~0.34 by step 250.
- Key peaks: ~0.28 (step 50), ~0.32 (step 150), ~0.34 (step 250).
2. **Path Depth**:
- Gradual increase from 4 to 12, with minor plateaus.
- Mean (blue) and Median (orange) lines nearly overlap.
3. **Intermediate Proportion**:
- Slow initial growth (0.01–0.2 by step 150), then exponential rise to 1.0 by step 250.
#### Group Size 6
1. **Validation Reward**:
- High volatility: sharp peaks (~0.375 at step 200) and troughs (~0.22 at step 1000).
- Ends at ~0.35 after 1600 steps.
2. **Path Depth**:
- Stepwise increases: 1→2 (step 200), 2→3 (step 600), 3→4 (step 1200).
- Mean and Median lines diverge slightly at later steps.
3. **Intermediate Proportion**:
- Slow growth (0.01–0.4 by step 1200), then rapid rise to 0.8 by step 1600.
### Key Observations
1. **Group Size Impact**:
- Larger groups (36) show smoother, more stable trends.
- Smaller groups (6) exhibit higher volatility in Validation Reward and stepwise Path Depth changes.
2. **Metric Correlations**:
- Validation Reward and Intermediate Proportion trends align positively in both groups.
- Path Depth increases correlate with Validation Reward improvements.
3. **Mean vs. Median**:
- Lines are closely aligned in Group 36, suggesting symmetric distributions.
- Divergence in Group 6 (Path Depth) indicates potential outliers in smaller datasets.
### Interpretation
The data suggests that larger group sizes (36) yield more stable and predictable performance metrics, while smaller groups (6) experience greater variability. The Validation Reward metric improves with training steps in both cases, but the smaller group requires significantly more steps (1600 vs. 250) to reach comparable performance levels. The Intermediate Proportion's exponential growth in Group 36 implies a critical threshold effect absent in the smaller group, which plateaus at 0.8. The Path Depth's stepwise behavior in Group 6 may reflect discrete decision-making stages, whereas the smoother progression in Group 36 suggests continuous optimization. These patterns highlight the importance of group size in balancing exploration (Path Depth) and exploitation (Validation Reward) in algorithmic training.