## Grouped Bar Charts: GPT-3 vs. Human Performance on Cognitive Tasks
### Overview
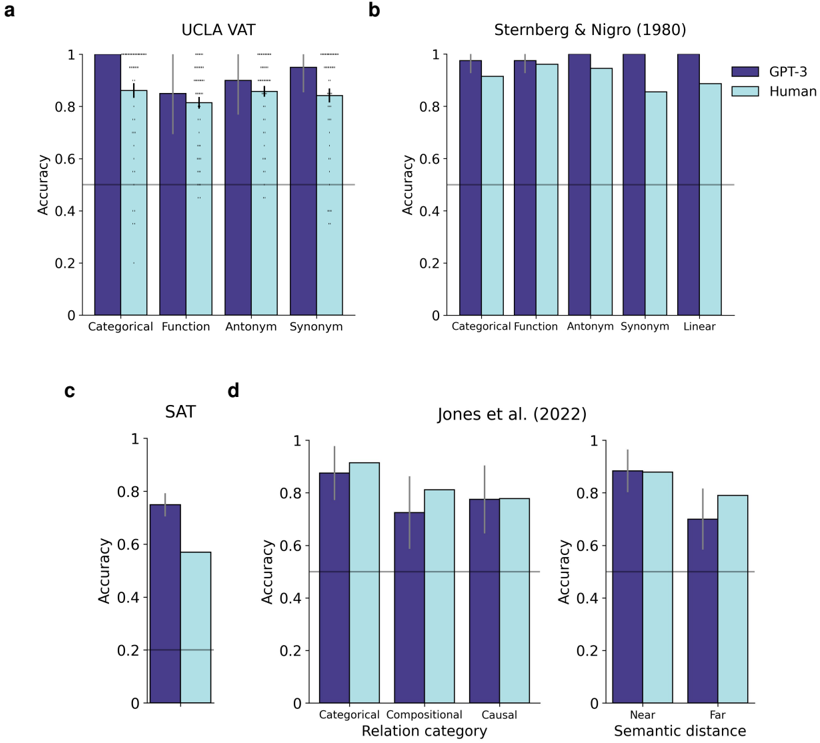
The image contains four subplots (labeled a, b, c, d) displaying grouped bar charts that compare the accuracy of GPT-3 (dark purple bars) and Human participants (light blue bars) across various cognitive and linguistic tasks. Each chart includes a horizontal line at 0.5 accuracy, likely representing chance performance. Error bars are present on all data points, indicating variability or confidence intervals.
### Components/Axes
* **Common Elements:**
* **Y-axis (All Charts):** Labeled "Accuracy," scaled from 0 to 1 with increments of 0.2.
* **Legend:** Located in the top-right corner of subplot **b**. It defines the two data series: "GPT-3" (dark purple) and "Human" (light blue).
* **Chance Line:** A solid horizontal line at y=0.5 across all subplots.
* **Subplot-Specific Elements:**
* **a. UCLA VAT:**
* **X-axis Categories:** "Categorical", "Function", "Antonym", "Synonym".
* **b. Sternberg & Nigro (1980):**
* **X-axis Categories:** "Categorical", "Function", "Antonym", "Synonym", "Linear".
* **c. SAT:**
* **X-axis:** No category labels; presents a single pair of bars.
* **d. Jones et al. (2022):**
* **Left Chart X-axis:** "Relation category" with categories "Categorical", "Compositional", "Causal".
* **Right Chart X-axis:** "Semantic distance" with categories "Near", "Far".
### Detailed Analysis
**Subplot a: UCLA VAT**
* **Trend:** GPT-3 accuracy is consistently higher than Human accuracy across all four categories.
* **Data Points (Approximate):**
* Categorical: GPT-3 ≈ 1.0, Human ≈ 0.85
* Function: GPT-3 ≈ 0.85, Human ≈ 0.80
* Antonym: GPT-3 ≈ 0.90, Human ≈ 0.85
* Synonym: GPT-3 ≈ 0.95, Human ≈ 0.85
**Subplot b: Sternberg & Nigro (1980)**
* **Trend:** GPT-3 maintains near-perfect accuracy across all categories. Human performance is high but shows a slight dip for "Synonym" and "Linear" tasks.
* **Data Points (Approximate):**
* Categorical: GPT-3 ≈ 0.98, Human ≈ 0.92
* Function: GPT-3 ≈ 0.98, Human ≈ 0.96
* Antonym: GPT-3 ≈ 1.0, Human ≈ 0.95
* Synonym: GPT-3 ≈ 1.0, Human ≈ 0.85
* Linear: GPT-3 ≈ 1.0, Human ≈ 0.88
**Subplot c: SAT**
* **Trend:** GPT-3 significantly outperforms Human participants on this task.
* **Data Points (Approximate):**
* GPT-3 ≈ 0.75
* Human ≈ 0.55
**Subplot d: Jones et al. (2022)**
* **Left Chart (Relation category):**
* **Trend:** Performance is closely matched between GPT-3 and Humans for "Categorical" and "Causal" relations. Humans show a slight advantage in "Compositional" relations.
* **Data Points (Approximate):**
* Categorical: GPT-3 ≈ 0.88, Human ≈ 0.92
* Compositional: GPT-3 ≈ 0.72, Human ≈ 0.82
* Causal: GPT-3 ≈ 0.78, Human ≈ 0.78
* **Right Chart (Semantic distance):**
* **Trend:** For "Near" semantic distance, performance is nearly identical. For "Far" semantic distance, Human accuracy is notably higher than GPT-3's.
* **Data Points (Approximate):**
* Near: GPT-3 ≈ 0.88, Human ≈ 0.88
* Far: GPT-3 ≈ 0.70, Human ≈ 0.80
### Key Observations
1. **GPT-3 Dominance:** GPT-3 achieves perfect or near-perfect accuracy (≈1.0) in the Sternberg & Nigro (1980) tasks and the UCLA VAT "Categorical" task.
2. **Human Performance Dip:** Human accuracy shows notable decreases in specific tasks: "Synonym" in the Sternberg & Nigro dataset, the SAT task overall, and "Compositional" relations in the Jones et al. data.
3. **Semantic Distance Effect:** The most significant performance gap favoring humans appears in the "Far" semantic distance condition (Jones et al., right chart), suggesting a potential limitation in GPT-3's handling of distant semantic relationships.
4. **Consistency Above Chance:** All recorded accuracies for both GPT-3 and Humans are well above the 0.5 chance line, indicating task engagement and non-random performance.
### Interpretation
The data suggests that GPT-3, a large language model, matches or exceeds human-level performance on a range of structured linguistic and cognitive tasks, particularly those involving categorical judgments and well-defined relations (e.g., antonyms, synonyms in some contexts). Its performance is remarkably consistent and high across the Sternberg & Nigro battery.
However, the model shows relative weaknesses in two areas: 1) tasks requiring compositional reasoning (Jones et al.), and 2) processing semantic relationships that are "far" or less conventional. The SAT result, where GPT-3 outperforms humans, is interesting and may reflect the model's extensive training on text similar to standardized test materials.
The charts collectively illustrate a nuanced picture of AI capability: excelling at pattern recognition and tasks aligned with its training data distribution, while potentially struggling with deeper compositional semantics and novel or distant conceptual links where human intuition or different cognitive mechanisms may have an advantage. The consistent error bars also indicate that while mean performance is high, there is variability in both human and model responses.