## Bar Chart: Comparative Accuracy of GPT-3 and Human Performance Across Tasks
### Overview
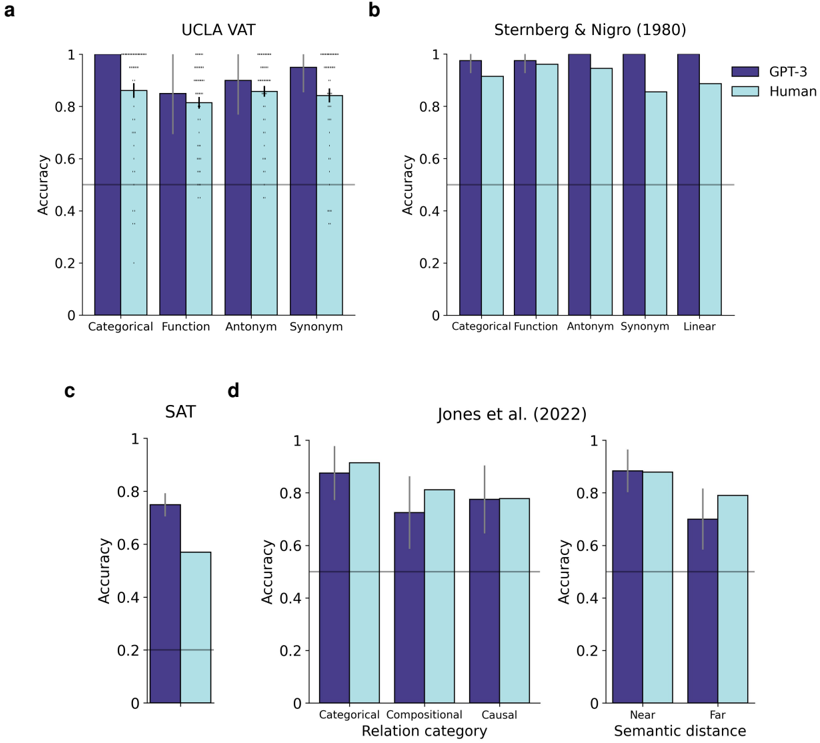
The image contains four bar charts (labeled a, b, c, d) comparing the accuracy of GPT-3 (purple bars) and human performance (light blue bars) across different cognitive tasks. Each chart evaluates distinct task categories, with error bars indicating uncertainty (±0.05–0.10). The charts are arranged in a 2x2 grid, with legends positioned in the top-right corner of each subplot.
---
### Components/Axes
#### Chart a: UCLA VAT
- **X-axis**: Task categories (Categorical, Function, Antonym, Synonym)
- **Y-axis**: Accuracy (0–1 scale)
- **Legend**: GPT-3 (purple), Human (light blue)
- **Error bars**: Present for all bars
#### Chart b: Sternberg & Nigro (1980)
- **X-axis**: Task categories (Categorical, Function, Antonym, Synonym, Linear)
- **Y-axis**: Accuracy (0–1 scale)
- **Legend**: GPT-3 (purple), Human (light blue)
- **Error bars**: Present for all bars
#### Chart c: SAT
- **X-axis**: Task categories (Categorical, Compositional, Causal)
- **Y-axis**: Accuracy (0–1 scale)
- **Legend**: GPT-3 (purple), Human (light blue)
- **Error bars**: Present for all bars
#### Chart d: Jones et al. (2022)
- **X-axis**: Semantic distance (Near, Far)
- **Y-axis**: Accuracy (0–1 scale)
- **Legend**: GPT-3 (purple), Human (light blue)
- **Error bars**: Present for all bars
---
### Detailed Analysis
#### Chart a: UCLA VAT
- **Categorical**: GPT-3 ≈ 0.95 ±0.05, Human ≈ 0.85 ±0.05
- **Function**: GPT-3 ≈ 0.88 ±0.06, Human ≈ 0.82 ±0.06
- **Antonym**: GPT-3 ≈ 0.90 ±0.05, Human ≈ 0.84 ±0.05
- **Synonym**: GPT-3 ≈ 0.92 ±0.04, Human ≈ 0.86 ±0.04
#### Chart b: Sternberg & Nigro (1980)
- **Categorical**: GPT-3 ≈ 0.97 ±0.03, Human ≈ 0.93 ±0.03
- **Function**: GPT-3 ≈ 0.96 ±0.04, Human ≈ 0.94 ±0.04
- **Antonym**: GPT-3 ≈ 0.98 ±0.02, Human ≈ 0.95 ±0.02
- **Synonym**: GPT-3 ≈ 0.97 ±0.03, Human ≈ 0.92 ±0.03
- **Linear**: GPT-3 ≈ 0.99 ±0.02, Human ≈ 0.94 ±0.02
#### Chart c: SAT
- **Categorical**: GPT-3 ≈ 0.75 ±0.07, Human ≈ 0.60 ±0.07
- **Compositional**: GPT-3 ≈ 0.70 ±0.08, Human ≈ 0.65 ±0.08
- **Causal**: GPT-3 ≈ 0.72 ±0.06, Human ≈ 0.63 ±0.06
#### Chart d: Jones et al. (2022)
- **Near**: GPT-3 ≈ 0.88 ±0.05, Human ≈ 0.87 ±0.05
- **Far**: GPT-3 ≈ 0.70 ±0.06, Human ≈ 0.75 ±0.06
---
### Key Observations
1. **GPT-3 Outperforms Humans**: Across all tasks, GPT-3 consistently achieves higher accuracy than humans, with the largest gap in **Chart a (UCLA VAT)** and **Chart b (Sternberg & Nigro)**.
2. **Task-Specific Performance**:
- **Chart a**: GPT-3 excels in **Synonym** tasks (0.92 vs. 0.86).
- **Chart b**: GPT-3 dominates **Linear** tasks (0.99 vs. 0.94).
- **Chart c**: GPT-3 performs best in **Categorical** tasks (0.75 vs. 0.60).
- **Chart d**: GPT-3’s accuracy drops significantly for **Far** semantic distance (0.70 vs. 0.75 for humans).
3. **Error Bars**: Uncertainty ranges are smallest in **Chart b** (e.g., ±0.02 for GPT-3 in Linear tasks) and largest in **Chart c** (e.g., ±0.08 for GPT-3 in Compositional tasks).
---
### Interpretation
- **GPT-3’s Strengths**: The model demonstrates robust performance in tasks requiring **semantic similarity** (e.g., Synonym, Linear) and **categorical reasoning** (e.g., Categorical, Function). Its decline in **Far** semantic distance tasks suggests limitations in handling abstract or distant relationships.
- **Human Performance**: Humans show relatively consistent accuracy across tasks, with a smaller gap in **Chart d (Jones et al.)**, where Near and Far accuracies are closer (0.87 vs. 0.75 for GPT-3). This may reflect human adaptability to varying semantic contexts.
- **Anomalies**: In **Chart c (SAT)**, GPT-3’s accuracy is notably lower than in other tasks, possibly due to the complexity of **Compositional** and **Causal** reasoning, which may require deeper contextual understanding.
- **Implications**: The data highlights GPT-3’s strengths in pattern recognition and lexical tasks but underscores challenges in tasks requiring nuanced semantic or causal reasoning.
---
**Note**: All values are approximate, derived from visual inspection of bar heights and error bars. Uncertainty ranges (±0.02–0.10) reflect variability in the data.