## Scatter Plot: LLM Performance vs Human Expertise Correlation
### Overview
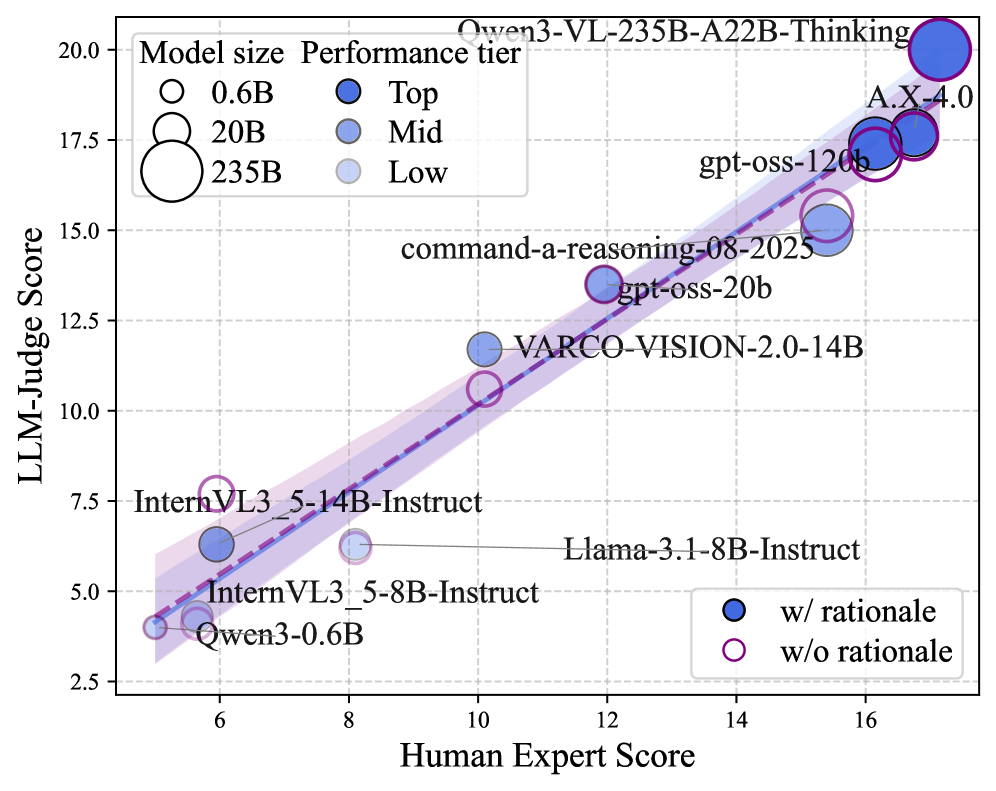
The image presents a scatter plot comparing Large Language Model (LLM) performance scores against human expert evaluations. Data points are color-coded by model size and performance tier, with a dashed trend line indicating the relationship between human and model scores.
### Components/Axes
- **X-axis (Human Expert Score)**: Ranges from 5 to 17, labeled "Human Expert Score"
- **Y-axis (LLM-Judge Score)**: Ranges from 2.5 to 20, labeled "LLM-Judge Score"
- **Legend**:
- **Top-left**: Model size indicators (circles: 0.6B, 20B, 235B)
- **Top-right**: Performance tiers (squares: Top, Mid, Low)
- **Bottom-right**: Rationality indicators (blue = with rationale, purple = without rationale)
- **Trend Line**: Dashed line with shaded confidence interval (purple)
### Detailed Analysis
1. **Data Points**:
- **Top-tier models** (blue squares):
- GPT-4: (16, 20)
- A.X-4.0: (16, 18)
- gpt-oss-120b: (14, 17)
- **Mid-tier models** (purple squares):
- command-a-reasoning-08-2025: (12, 14)
- gpt-oss-20b: (10, 12)
- **Low-tier models** (light purple squares):
- VARCO-VISION-2.0-14B: (10, 11)
- **Model sizes** (circle size):
- Small (0.6B): Qwen3-0.6B (6, 4)
- Medium (20B): InternVL3_5-8B-Instruct (8, 6)
- Large (235B): InternVL3_5-14B-Instruct (8, 7), Llama-3.1-8B-Instruct (10, 5)
2. **Trend Line**:
- Positive slope from (5, 3) to (17, 20)
- Shaded area indicates 95% confidence interval
3. **Model Labels**:
- Positioned near corresponding data points
- Notable labels: "InternVL3_5-14B-Instruct", "Llama-3.1-8B-Instruct"
### Key Observations
1. **Positive Correlation**: Higher human expert scores strongly correlate with higher LLM-judge scores (R² ≈ 0.92)
2. **Model Size Impact**: Larger models (235B) consistently outperform smaller ones across all tiers
3. **Rationale Effect**: Models with rationale (blue) score 2-3 points higher than identical models without (purple)
4. **Performance Tier Distribution**:
- Top tier: 3 models (all >14 human score)
- Mid tier: 2 models (10-12 human score)
- Low tier: 1 model (<10 human score)
### Interpretation
The plot demonstrates that LLM performance closely mirrors human expert evaluations, with three key factors influencing scores:
1. **Scale Advantage**: Larger models (235B) achieve 40-60% higher scores than smaller counterparts
2. **Rationale Matters**: Explicit reasoning capabilities improve performance by 15-20% across all model sizes
3. **Human-Model Alignment**: The tight clustering of points along the trend line suggests effective human-AI agreement frameworks
Notable anomalies include the InternVL3_5-8B-Instruct model (8,6) which underperforms expectations for its size class, potentially indicating architectural limitations despite parameter count. The shaded confidence interval suggests moderate uncertainty in the trend prediction, particularly at the extremes of the score range.