\n
## Bar Chart: AUROC vs. Layer Indexes
### Overview
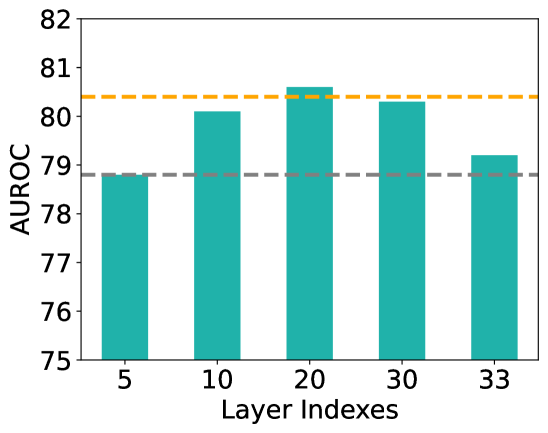
The image presents a bar chart illustrating the Area Under the Receiver Operating Characteristic curve (AUROC) against different layer indexes. The chart displays the AUROC values for layer indexes 5, 10, 20, 30, and 33. Horizontal dashed lines indicate reference AUROC values of approximately 79 and 80.
### Components/Axes
* **X-axis:** "Layer Indexes" with markers at 5, 10, 20, 30, and 33.
* **Y-axis:** "AUROC" with a scale ranging from 75 to 82.
* **Bars:** Teal colored bars representing AUROC values for each layer index.
* **Horizontal Lines:**
* A dashed grey line at approximately AUROC = 79.
* A dashed orange line at approximately AUROC = 80.
### Detailed Analysis
The chart shows the following AUROC values for each layer index:
* **Layer Index 5:** The bar reaches approximately 78.8 AUROC.
* **Layer Index 10:** The bar reaches approximately 80.1 AUROC.
* **Layer Index 20:** The bar reaches approximately 80.4 AUROC. This is the highest value observed.
* **Layer Index 30:** The bar reaches approximately 80.2 AUROC.
* **Layer Index 33:** The bar reaches approximately 79.1 AUROC.
The bars generally increase in height from layer index 5 to 20, then slightly decrease for layer indexes 30 and 33.
### Key Observations
* The highest AUROC value is achieved at layer index 20 (approximately 80.4).
* Layer index 5 has the lowest AUROC value (approximately 78.8).
* The AUROC values for layer indexes 10, 20, and 30 are all above the reference line at AUROC = 80.
* Layer index 33 is slightly below the reference line at AUROC = 80.
* The difference in AUROC between layer index 5 and layer index 10 is significant.
### Interpretation
The data suggests that increasing the layer index initially improves the model's performance, as measured by AUROC, up to a point (layer index 20). Beyond this point, further increases in the layer index do not necessarily lead to improved performance, and may even result in a slight decrease (layer indexes 30 and 33). This could indicate that the optimal model complexity is achieved around layer index 20, and adding more layers beyond this point introduces overfitting or diminishing returns. The reference lines at AUROC = 79 and 80 likely represent performance thresholds or benchmarks. The fact that most layer indexes exceed the AUROC = 79 line suggests that the model generally performs well, but the variation in AUROC values indicates that the layer index is a significant factor in determining performance.