## Bar Chart: AUROC Performance Across Layer Indexes
### Overview
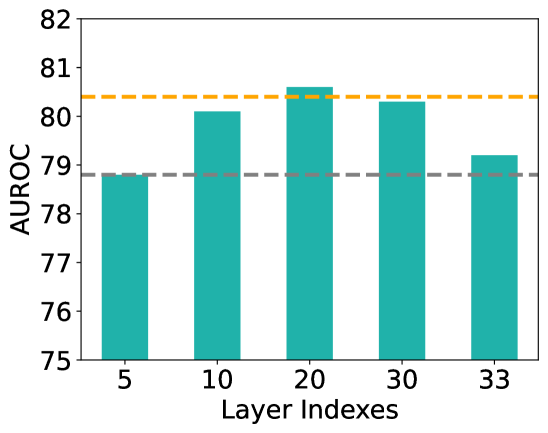
The chart displays the Area Under the Receiver Operating Characteristic curve (AUROC) performance metric across five distinct layer indexes (5, 10, 20, 30, 33). AUROC values range from 75 to 82 on the y-axis, with two horizontal reference lines at 79 (gray dashed) and 80.5 (yellow dashed). The bars represent performance at each layer index, with teal-colored bars centered under their respective x-axis labels.
### Components/Axes
- **X-axis (Layer Indexes)**: Discrete categories labeled 5, 10, 20, 30, 33. Bars are evenly spaced and centered under their labels.
- **Y-axis (AUROC)**: Continuous scale from 75 to 82, with increments of 1. Two horizontal reference lines:
- Gray dashed line at 79.0
- Yellow dashed line at 80.5
- **Bars**: Teal-colored vertical bars representing AUROC values for each layer index.
### Detailed Analysis
- **Layer 5**: AUROC ≈ 78.8 (below the 79.0 reference line).
- **Layer 10**: AUROC ≈ 80.2 (between 79.0 and 80.5 lines).
- **Layer 20**: AUROC ≈ 80.7 (highest value, just above the 80.5 reference line).
- **Layer 30**: AUROC ≈ 80.4 (slightly below Layer 20, near the 80.5 line).
- **Layer 33**: AUROC ≈ 79.2 (between 79.0 and 80.5 lines).
### Key Observations
1. **Peak Performance**: Layer 20 achieves the highest AUROC (80.7), surpassing the 80.5 reference line.
2. **Decline After Layer 20**: Performance drops at Layer 30 (80.4) and further at Layer 33 (79.2), suggesting diminishing returns or potential overfitting in deeper layers.
3. **Baseline Comparison**: All layers except Layer 5 exceed the 79.0 reference line, indicating generally strong performance.
### Interpretation
The data suggests that increasing layer complexity initially improves model performance (up to Layer 20), but further layers degrade AUROC. This could indicate an optimal layer count at 20, beyond which the model may overfit or lose generalization ability. The 80.5 reference line (yellow) may represent a target threshold, with Layer 20 being the only index to exceed it. The decline at Layer 33 aligns with common patterns in deep learning architectures, where excessive depth can harm performance without proper regularization.